No products in the cart.


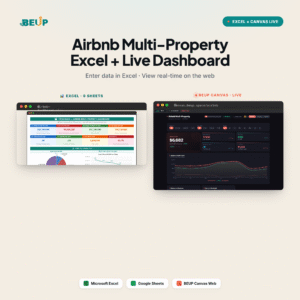
Dropshipping Profit Analysis + Live Dashboard — Multi-Platform E-commerce Tool Kit
499.000 VND
A suite of tools to calculate actual profit for each product when selling on multiple platforms (Amazon, TikTok Shop, eBay, Shopify). 10 interconnected sheets linked to a 4-part dashboard, comparing suppliers, tracking ad effectiveness by product, and forecasting cash flow — predict 1–3 months in advance when platforms hold funds, causing shortages. Completely based on Excel formulas, no macros required, compatible with both Excel and Google Sheets. Includes sample data and a blank version — bilingual Vietnamese · English.
Sold: 0 items
Category:
BEUP Track
Multi-platform dropshipping means tracking revenue on Amazon, TikTok Shop, eBay, and Shopify — each with its own fee schedule, payment cycle, and ad effectiveness calculation. Most sellers know their revenue but not their actual net profit — the amount left after deducting costs, platform fees, shipping fees, returns, and advertising expenses. This toolkit answers that question for each product, platform, and month — using only Excel formulas, no macros or add-ins required.
🆕 FREE LIVE DASHBOARD — BEUP CANVAS
With this template, you have additional free lifetime access to BEUP Canvas — turn your Excel or Google Sheets file into an interactive online dashboard in 30 seconds.
- Open it now: canvas.beup.space/dropship
- How it works: upload Excel file (.xlsx) or paste Google Sheets link → Canvas renders dashboard with interactive filters, real-time charts
- Features: drill-down by month/floor/product/campaign, share link with colleagues, view on mobile without Excel app
- Privacy: Canvas runs entirely on your browser — data is NOT stored on BEUP server
- Auto-sync: each time you update Google Sheets, the dashboard updates automatically
Included in the template price (no extra charge). This is BEUP's exclusive USP — other templates only sell Excel files, BEUP gives you a live dashboard for free.
10 CALCULATION PAGES — A COMPLETE SYSTEM
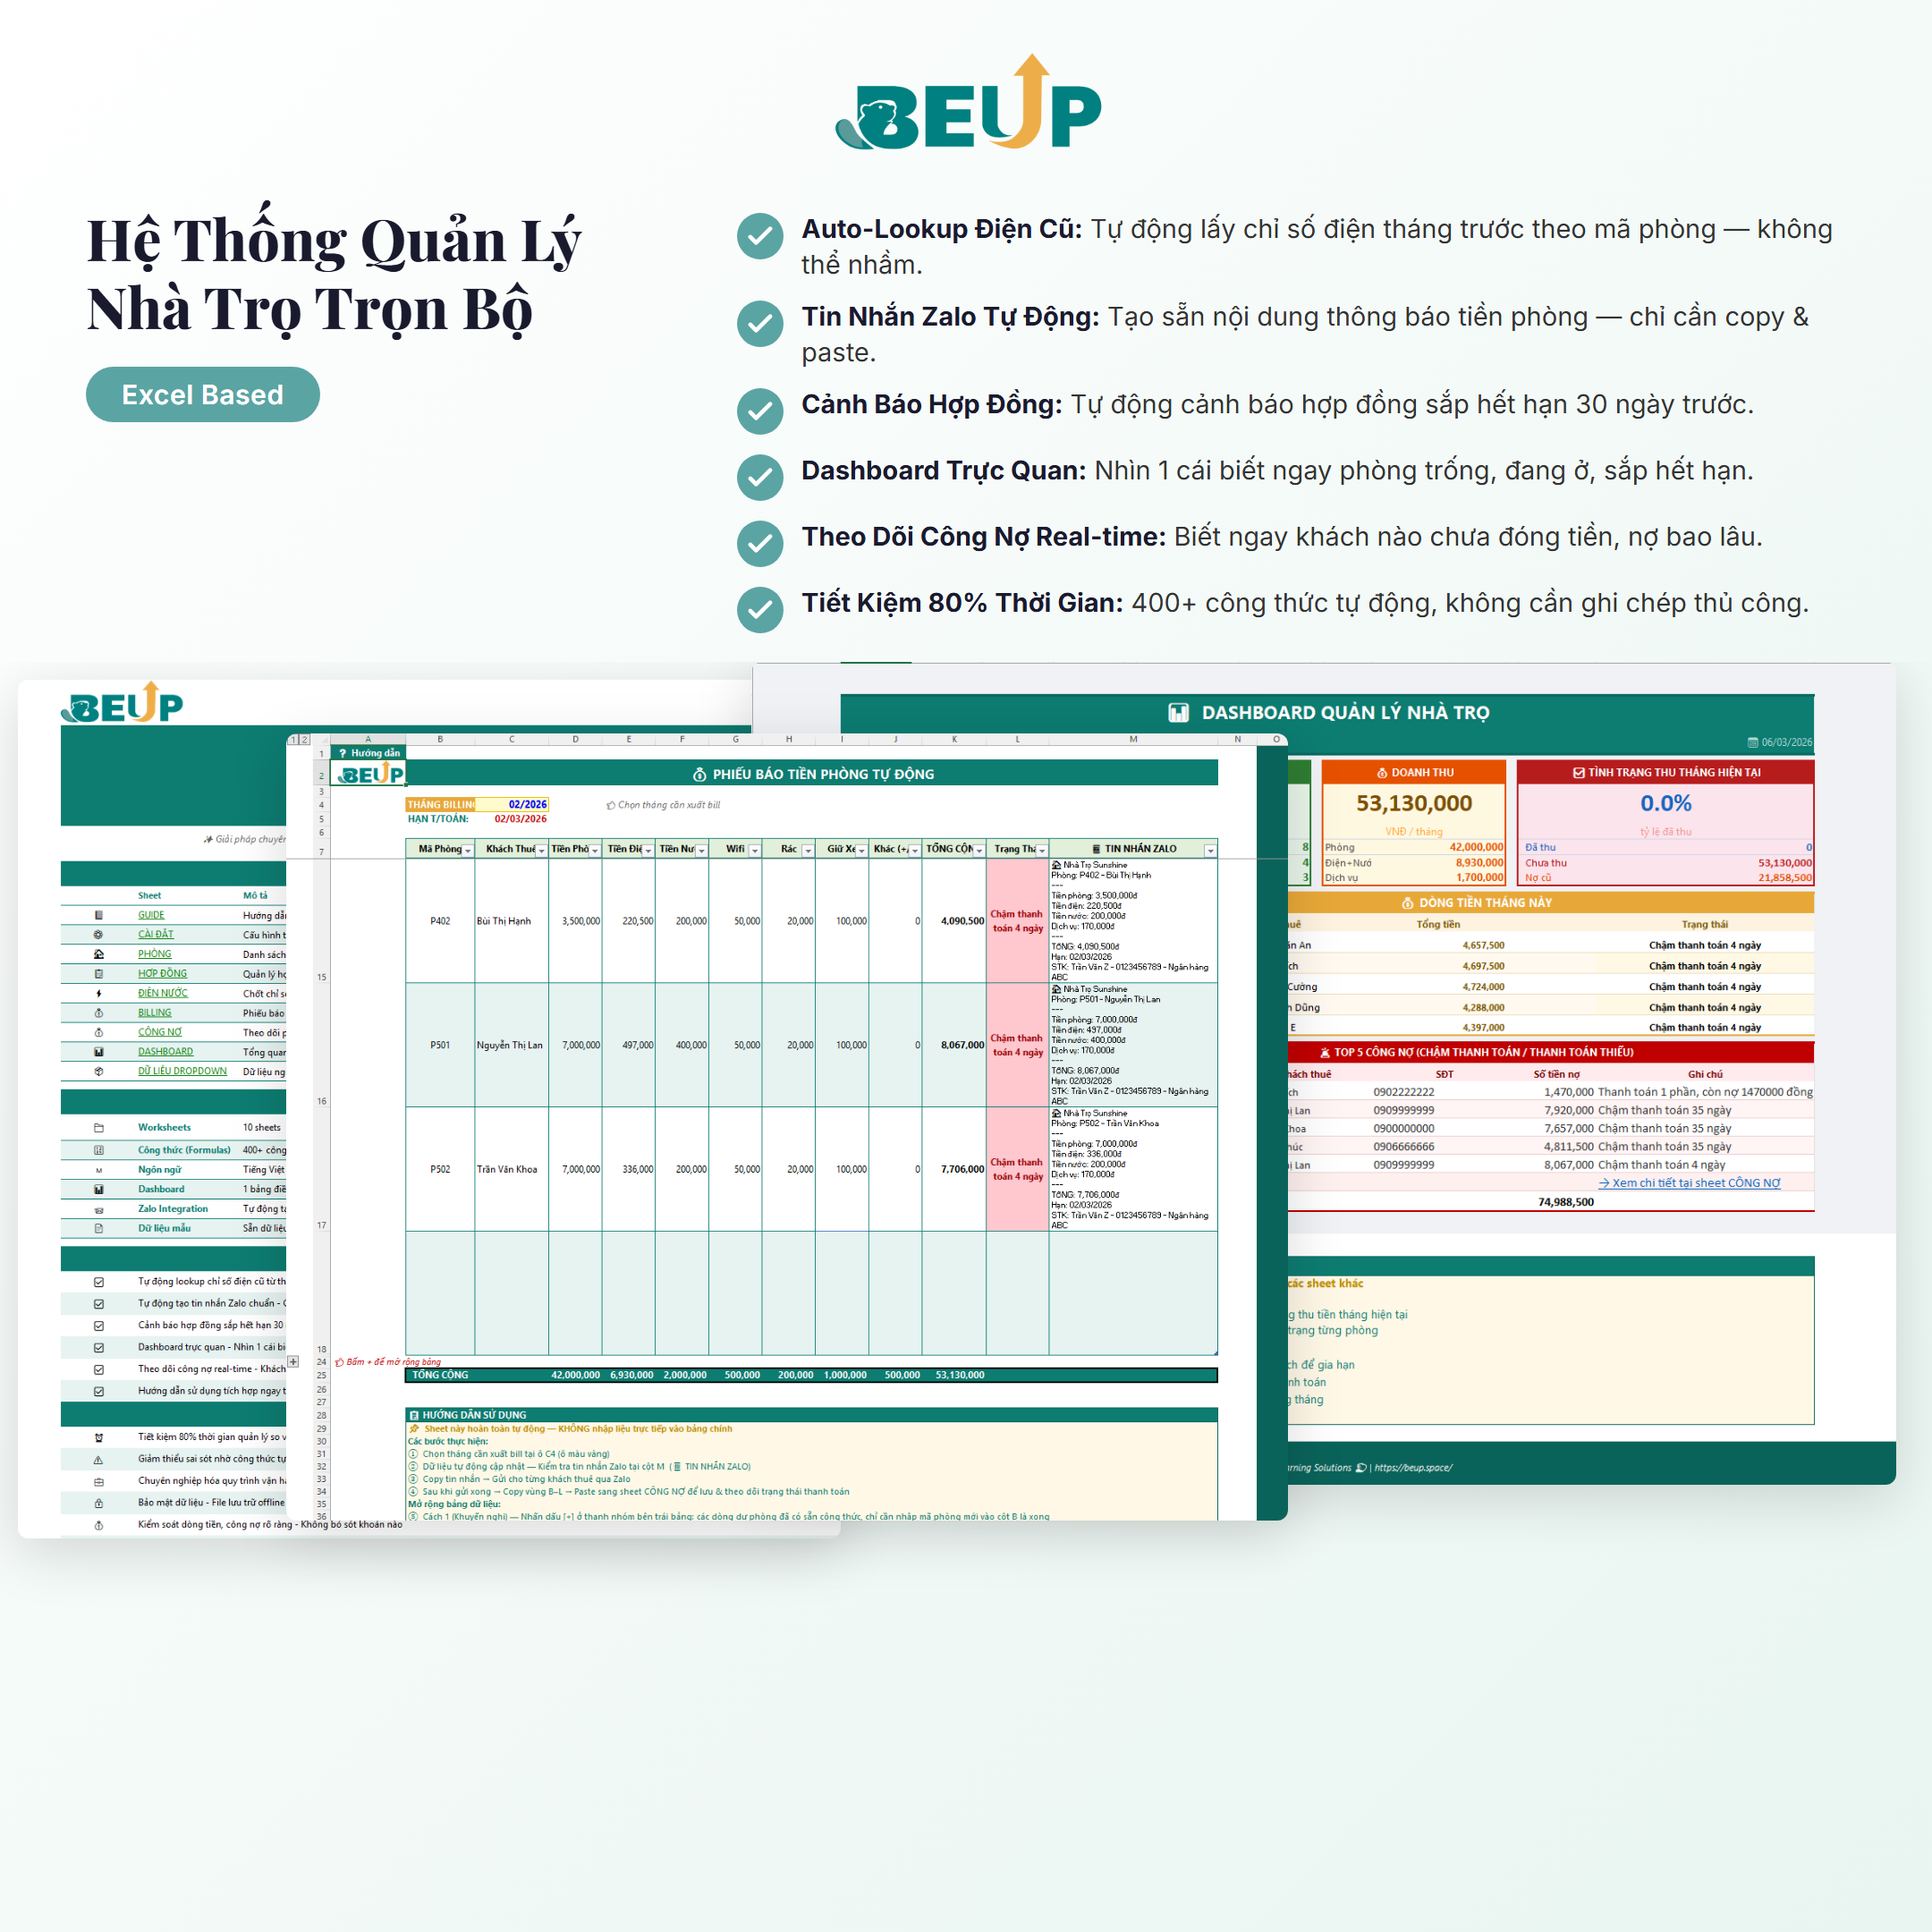
- 4-Part Dashboard — Overview (5 key metrics + monthly revenue chart), Products (Top 15 profitable products + ad effectiveness by SKU), Advertising (expenses by platform + ROAS — return on ad spend), Cash Flow (inflows/outflows + expense structure). All auto-filtered by Month and Platform.
- Suppliers — Supplier list with total cost of goods (purchase price + shipping + tax), quality score, and automatic ranking based on data — no guessing.
- Products — SKU catalog with cost price (what you pay the supplier), inbound shipping fee, selling price, profit margin %, and status (Active · Paused · Discontinued).
- Price Comparison — Compare inbound prices for the same product across multiple suppliers, with automatic lookup of product names and total inbound costs.
- Sales — Order logbook. Platform and supplier fees are automatically displayed when you enter the product code; you only need to fill in Date · Platform · Product Code · Quantity · Revenue.
- Advertising — Track expenses by campaign: CPC (cost per click), CPA (cost per acquisition), and ROAS (return on ad spend). Allocate ad spend to each product to see which ones are burning through your budget.
- Costs — Operating expenses outside of cost of goods and advertising (personnel, software, packaging, shipping, returns) categorized by group.
- Profit Analysis — Detailed profit/loss statement for each product code, profit by platform, Break-even ROAS (minimum threshold to run ads without losing money), and automatic ranking Expand · Maintain · Stop.
- Cash Flow — Money in/out by month, payment schedule of each platform (Amazon holds 14 days, TikTok 7 days…), warning of cash shortage 1–3 months before it happens.
- Settings — fees for 10 popular platforms, dropdown lists for category/status/supplier, system configuration — set up only once.
WHO IS THIS FOR?
- Multi-platform dropshipping seller — selling simultaneously on Amazon, TikTok Shop, eBay, Shopify and needing a place to know which products are truly profitable.
- Online sales advertiser — needs to know the advertising effectiveness of each product and the break-even threshold to decide whether to expand or stop the campaign.
- Those who work with multiple suppliers — comparing input prices, quality, and delivery time based on data rather than intuition.
- Operator of 1–5 products to 200+ products — a system that runs smoothly at both small and large scales.
- New dropshipping founders or those transitioning from one platform to multiple — needing a standardized financial framework from the start rather than building separate spreadsheets.
The toolkit has been tested with 200+ orders, 50+ products, and 4 platforms simultaneously without slowing down. Suitable for both Excel users on computers and Google Sheets in the cloud.
WHAT'S INCLUDED?
Each time you download, you receive 4 deliverables — organized in a format for use on any device:
Excel (.xlsx) — 2 files to download:
- Template — a blank version for you to enter real data
- Sample — includes 200+ sample orders and 50+ products to learn how the operating system works in 15 minutes
Google Sheets — 2 links “Make a copy”:
- Template — click → create your own copy in your Google account
- Sample — includes sample data, copy to your personal Google Drive
Bonus included:
- A “Guide” sheet with detailed 8-step input instructions, color conventions, and guidance for each sheet
- 10 interconnected sheets — update data in one place, reflect changes throughout the system
- Free lifetime updates for this version
One-time purchase — use on both Excel (offline desktop) and Google Sheets (cloud, multi-user). You choose the language when ordering — the system automatically delivers the correct version file.
HOW TO USE
- Download and open the SAMPLE file before — see the operating system run with sample data.
- Open TEMPLATE corresponding (Excel or Google Sheets) — start entering real data.
- Step 1: Setup — check fees for 10 channels, categories, dropdowns. Only done once.
- Step 2: Product — enter SKU, cost, selling price, channel.
- Step 3: Supplier — enter supplier, shipping time, return rate, quality.
- Steps 4–7: Sales · Advertising · Costs · Price Comparison — updated daily or weekly.
- Step 8: Dashboard — filter by Month and Channel to view KPIs; decide to scale/maintain/stop each SKU.
COMPARISON WITH OTHER SOLUTIONS
| Criterion | This Tool | Self-made spreadsheet | Dedicated SaaS |
|---|---|---|---|
| Cost | ₫499,000 one-time payment | Free | $30–100/month |
| Multi-channel (Amazon · TikTok · eBay · Shopify) | ✓ | ~ | ✓ |
| ROAS by SKU | ✓ | ✗ | ~ |
| Automatic supplier comparison and ranking | ✓ | ✗ | ~ |
| Cash flow forecast for 1–3 months | ✓ | ✗ | ~ |
| Offline operation (Excel desktop) | ✓ | ✓ | ✗ |
| Unlimited formula customization | ✓ | ✓ | ✗ |
| Complete data ownership | ✓ | ✓ | ✗ |
SYSTEM REQUIREMENTS
- Excel: Microsoft Excel 2019 or later (Windows/Mac) or Microsoft 365.
- Google Sheets: Free Google account — open directly in the browser.
- No macros required — the entire system runs on formulas (INDEX/MATCH, no XLOOKUP) and is compatible with both old Excel and Google Sheets.
FREQUENTLY ASKED QUESTIONS
I'm new to dropshipping, is it difficult to use?
No. Open the SAMPLE file first to understand the system, then switch to the TEMPLATE. The “Guide” sheet takes you through 8 steps to enter data — enough to get started within 60 minutes.
Does it work with Shopee, Lazada, TikTok Shop Vietnam?
Yes. The “Settings” sheet allows you to enter fees for any marketplace (with 10 default international marketplaces: Amazon, TikTok Shop, eBay, Shopify, Etsy, Lazada, Shopee, Tiki, Sendo, Woocommerce). Add your own marketplace if needed.
Does it support multiple stores/accounts on the same floor?
Yes. Use the “Account / Store” column in the Sales sheet — the dashboard can filter by account.
Is the Google Sheets file different from the Excel file?
The structure and formulas are identical. You get both to choose the platform that suits your workflow (offline Excel or cloud-based Google Sheets, multi-user).
Is there an automatic floor fee update?
No — marketplace fees are entered manually in the “Settings” sheet. Because each marketplace changes its fee policy over time, you should review and update them quarterly.
Is there a refund policy?
Refund within 7 days if the file cannot be opened or the formula is incorrect. Since it is a digital product that has been delivered, refunds are not provided due to a change of mind.
Is there support when encountering errors?
Yes. Email support@beup.space — response within one business day.
Only logged in customers who have purchased this product may leave a review.
Related products
- Quản Lý Đội Xe & Chi Phí Chuyến Hàng — Excel + BEUP Canvas0.00 out of 5Price range: from 499.000 VND to 799.000 VNDBuy Now This product has multiple variants. The options may be chosen on the product page
- Construction Cost Estimation & Cash Flow – Accurate Interior Budget Management | Excel Template0.00 out of 5Price range: from 499.000 VND to 799.000 VNDBuy Now This product has multiple variants. The options may be chosen on the product page
- Managing Multiple Airbnb Listings — Excel + Live Dashboard on BEUP Canvas0.00 out of 5Price range: from 499.000 VND to 799.000 VNDBuy Now This product has multiple variants. The options may be chosen on the product page


A Digital Asset Ecosystem and Work Operating System for Individuals & Teams
SUPPORT
Copyright © 2026 BEUP Learning Solutions
MST: 3301755602
Reviews
There are no reviews yet.