No products in the cart.



Vehicle Team & Trip Expense Management — Excel + BEUP Canvas
Price range: from 499.000 VND to 799.000 VND
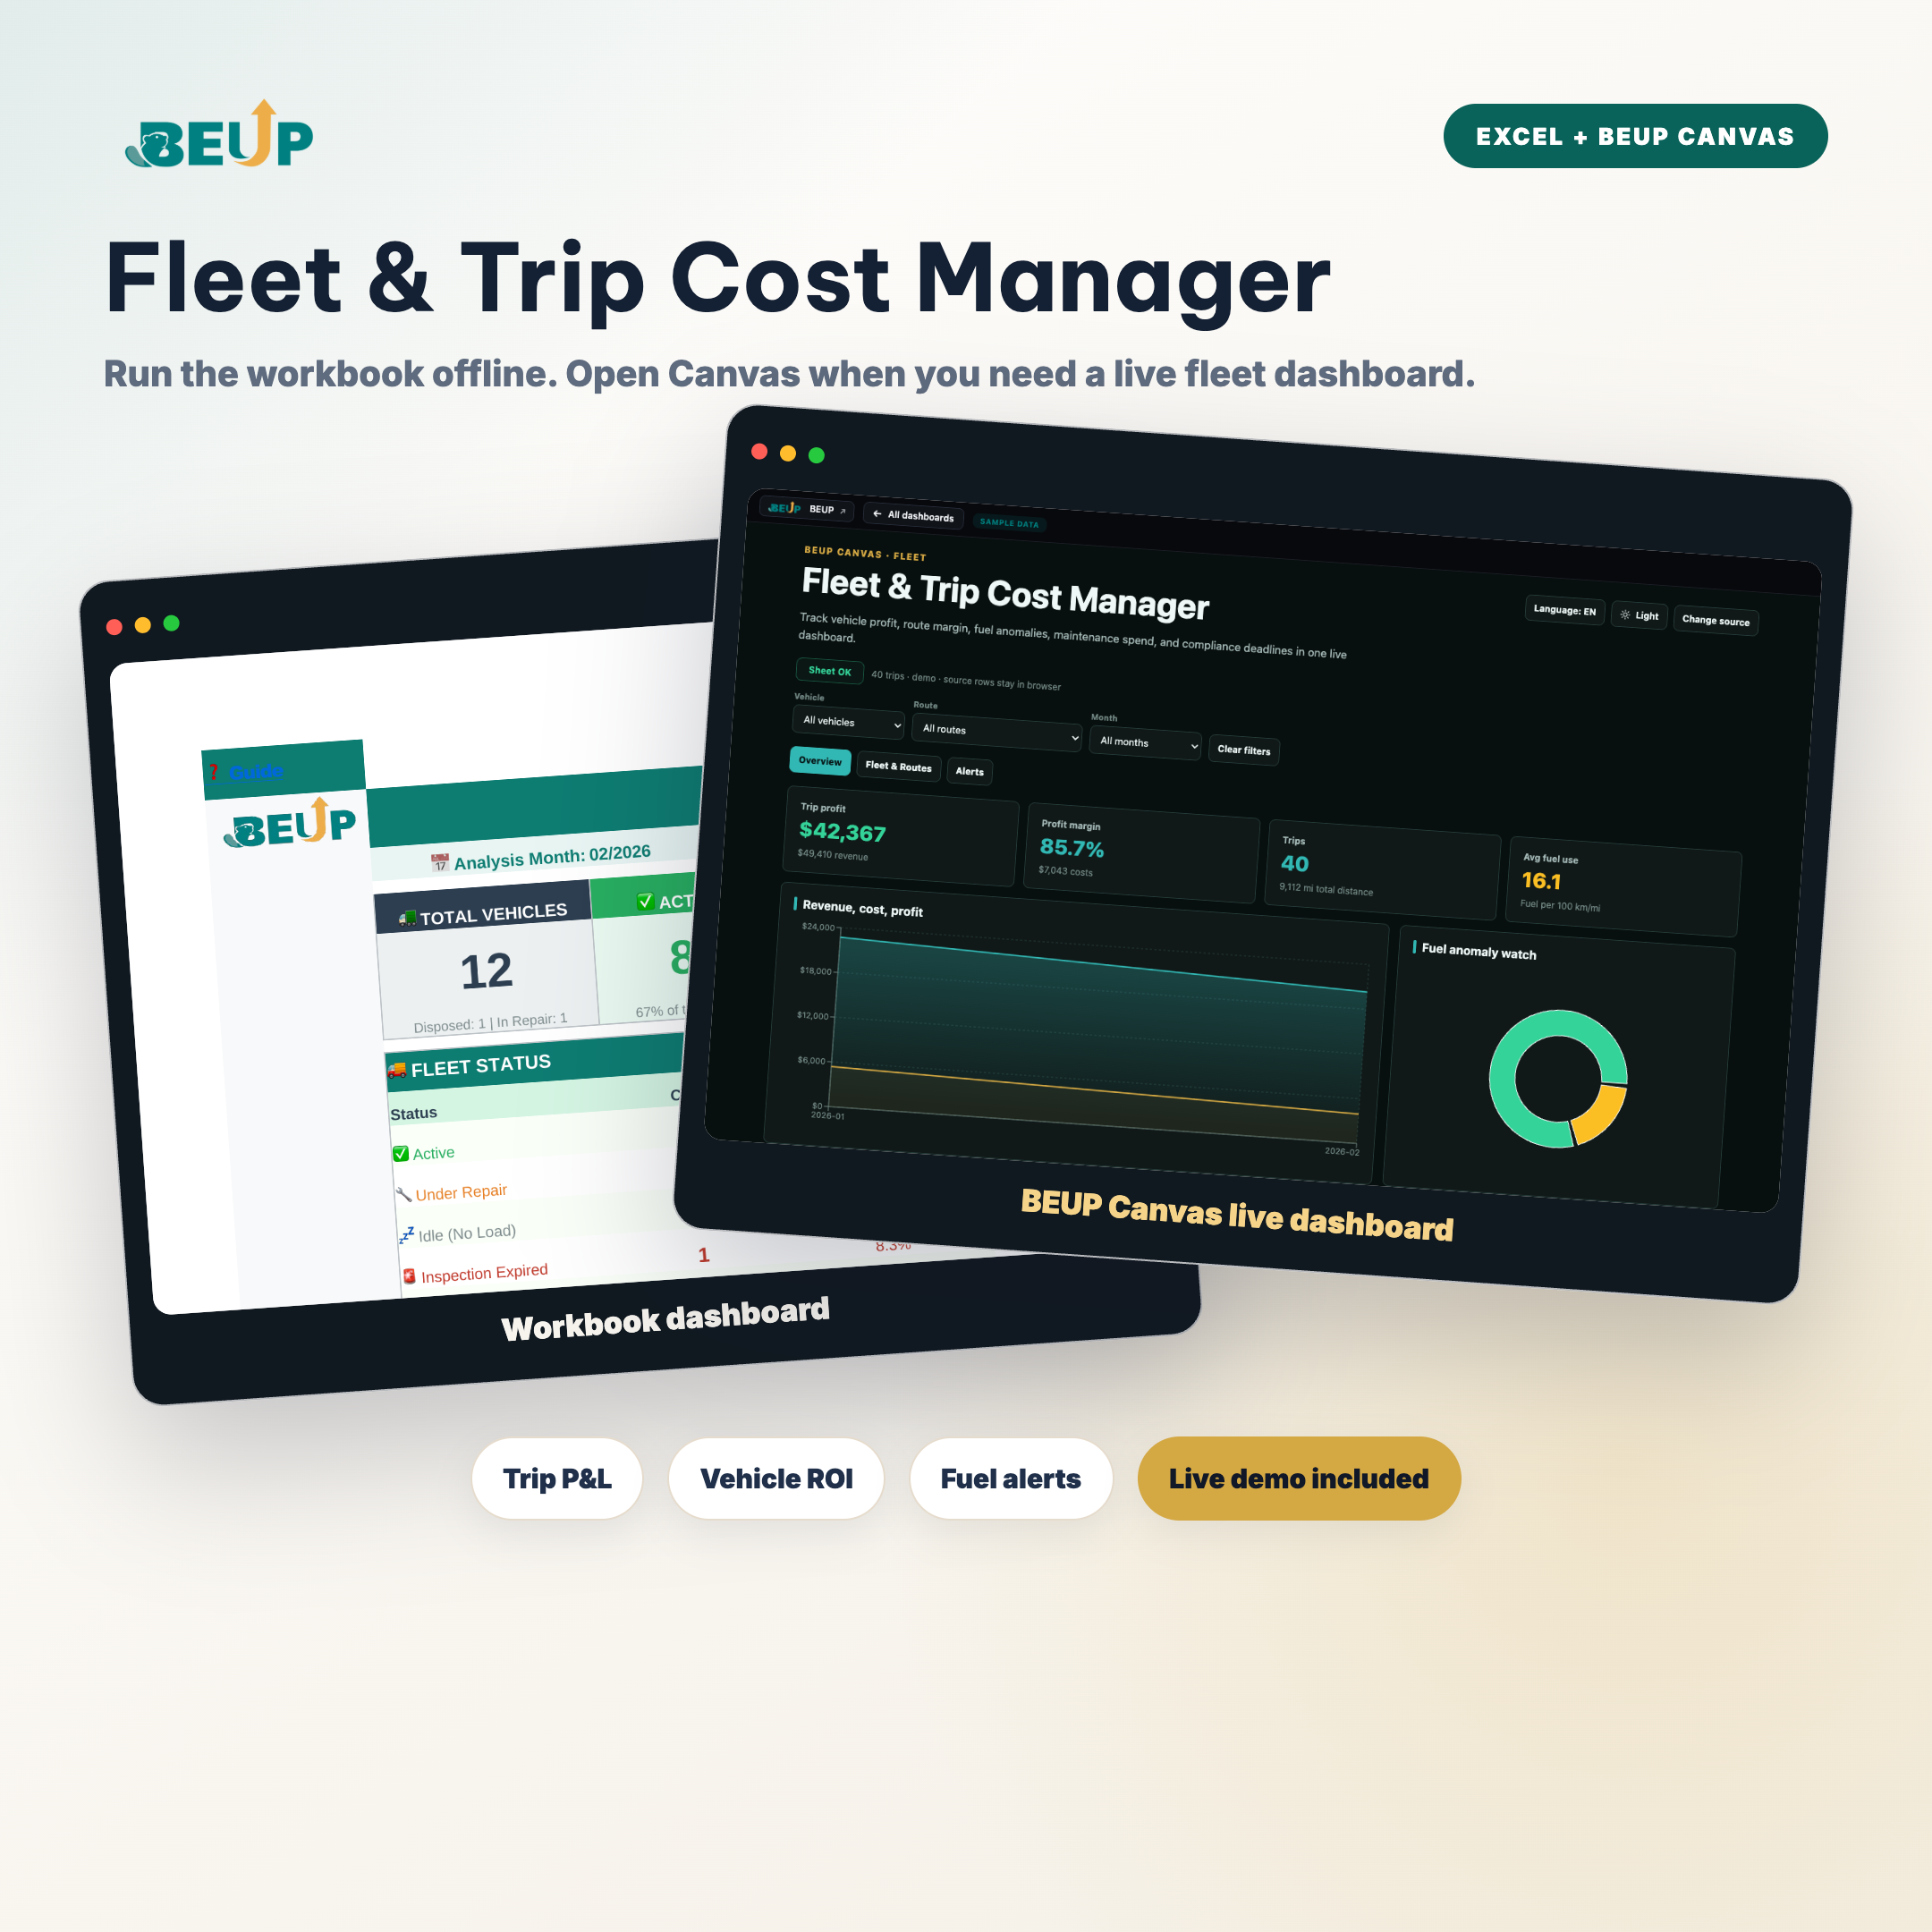
Excel file + BEUP Canvas for vehicle team: track the cost of each vehicle, profit/loss of each trip, fuel consumption, maintenance, registration and route efficiency. Workbook for offline data entry; a BEUP Canvas live dashboard helps view KPI, filters by vehicle/route/month and switches VI/EN with corresponding sample data.
Sold: 0 items
Fleet Management & Trip Efficiency — Controls costs per vehicle, per trip; knows which vehicle is profitable, which route is losing, with just Excel and BEUP Canvas.
This system combines workbook Excel / Google Sheets to enter operational data with a BEUP Canvas live dashboard to quickly view KPI on the web. You still own your data file; Canvas is a dashboard companion to present figures, filter by vehicle/route/month and switch language VI/EN when needed.
👉 Open the BEUP Canvas live demo
YOU GET 2 DASHBOARDS — POWERED BY THE SAME DATA
📊 Workbook dashboard
- Enter and save data directly in Excel / Google Sheets files.
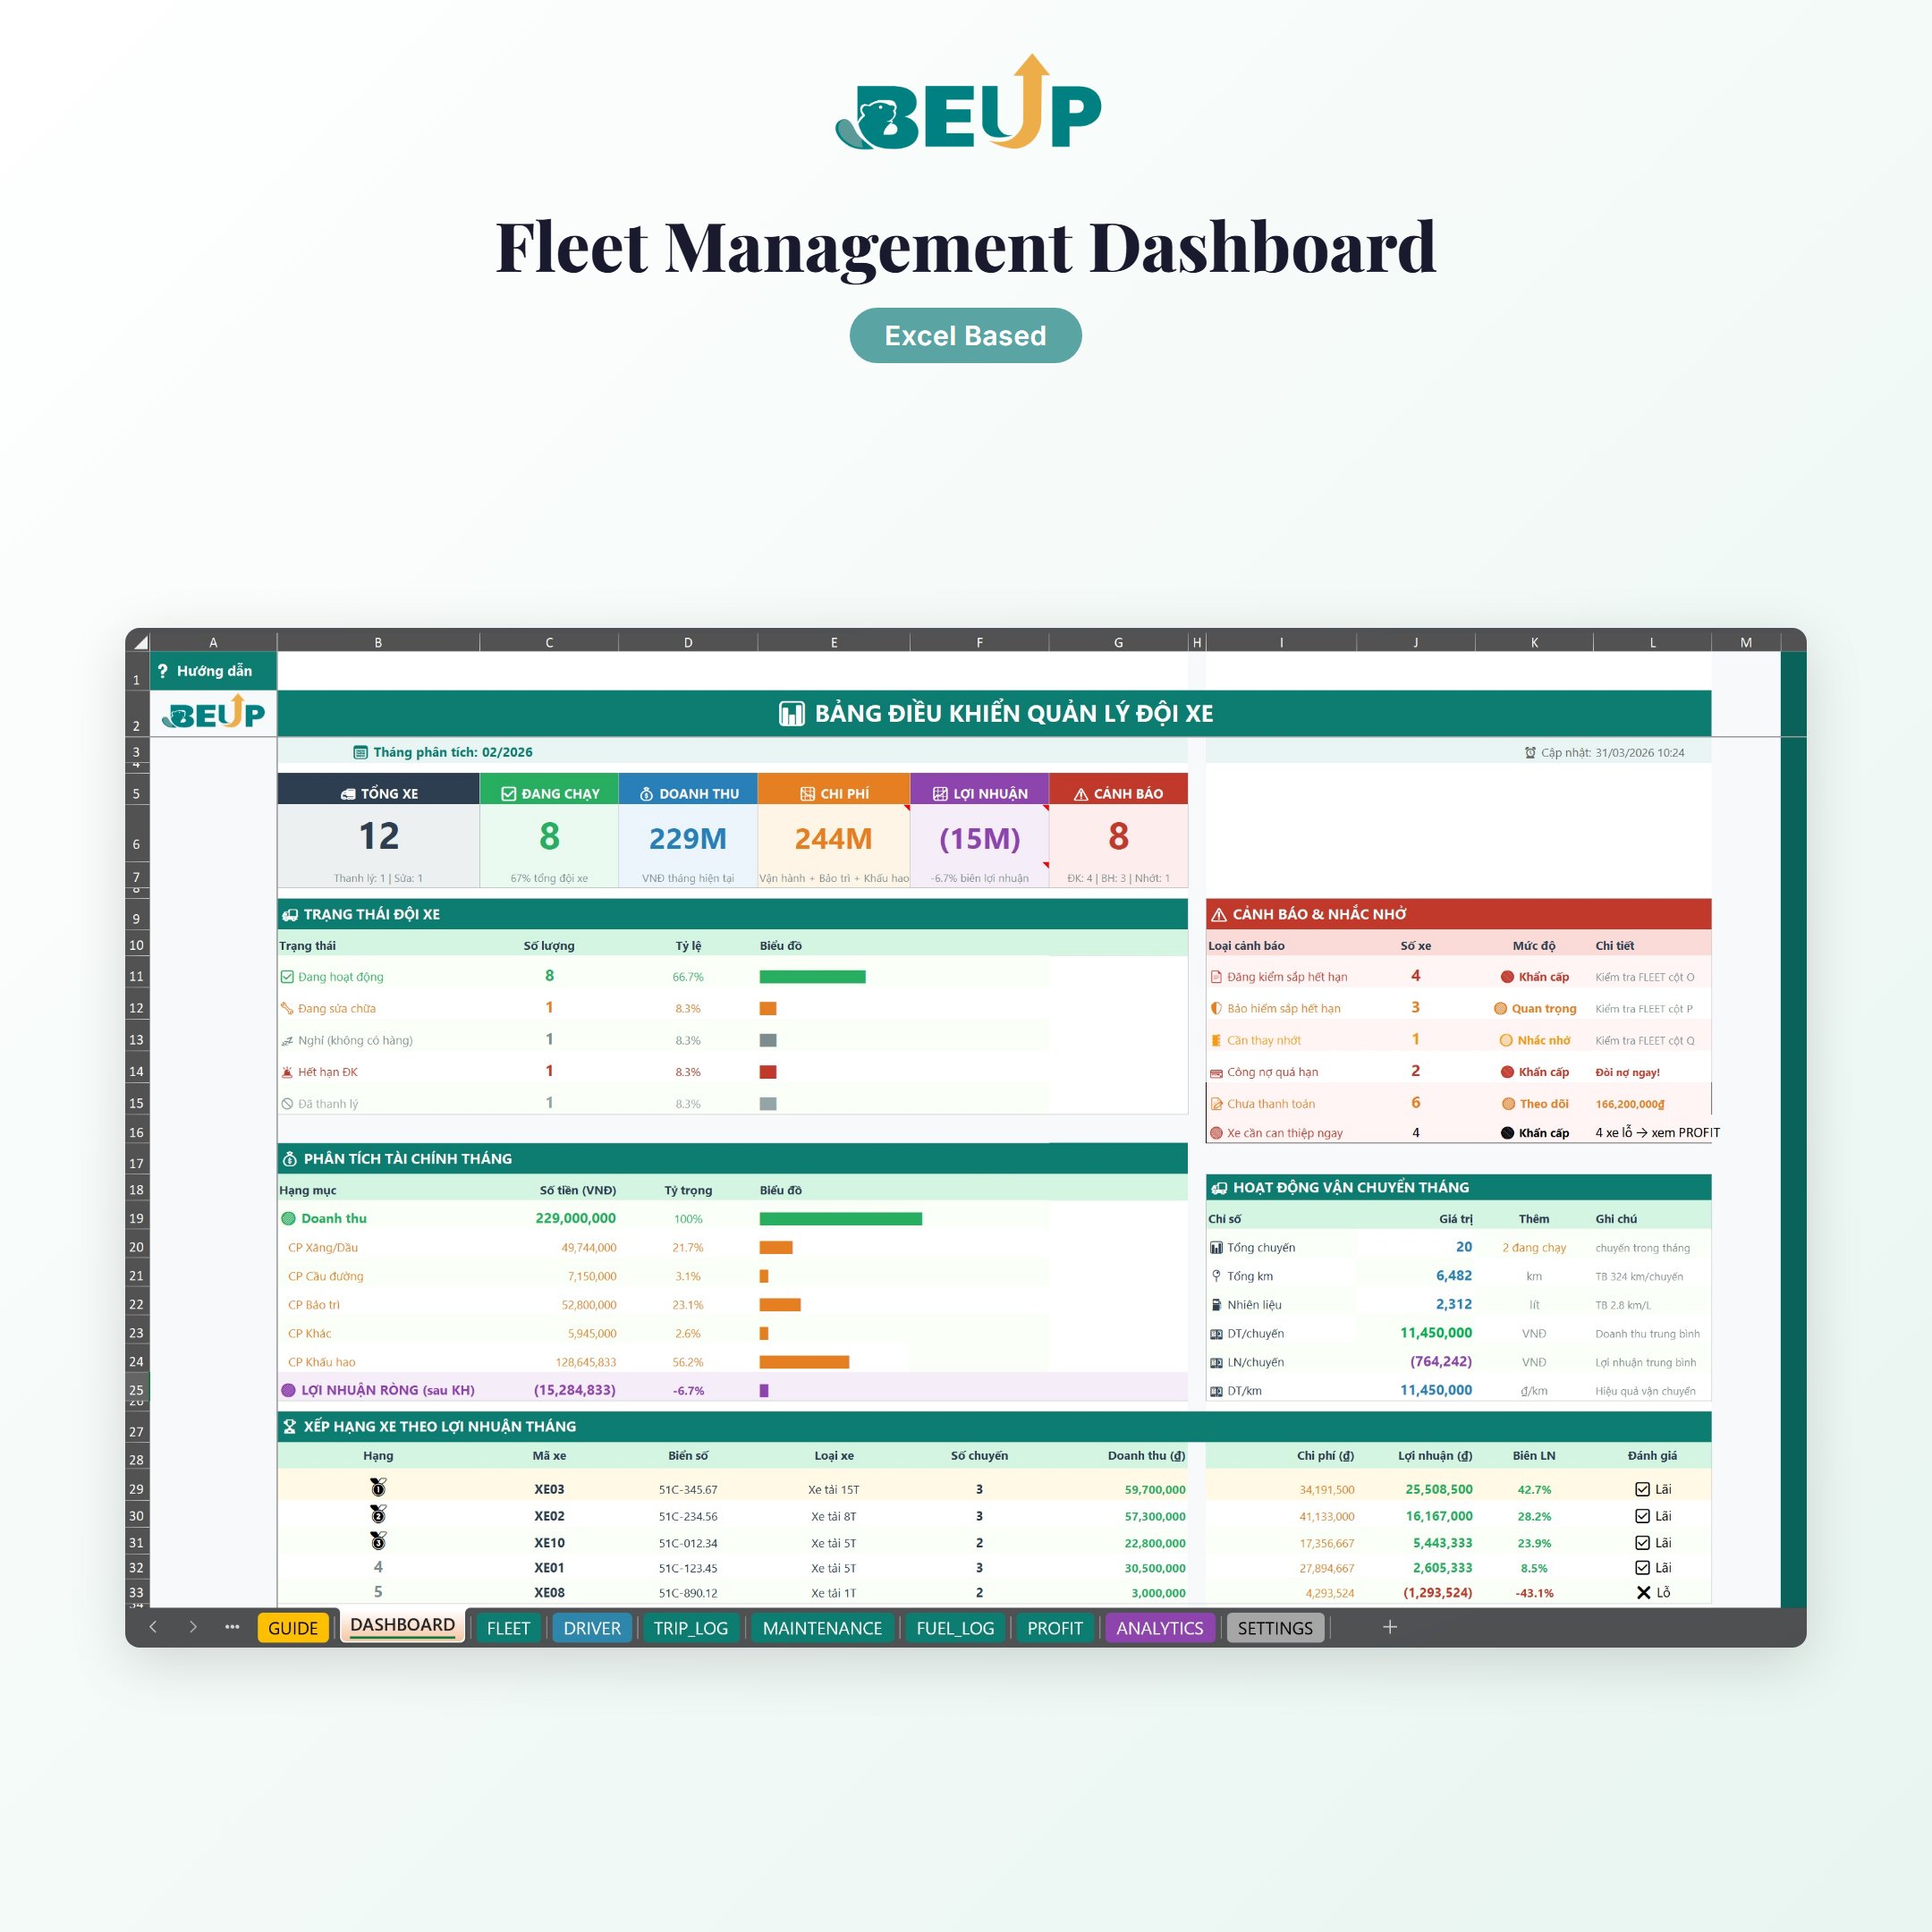
- Track revenue, expenses, net profit, route efficiency, maintenance, and fuel right in your workbook.
- Suitable for offline operations, internal backup, and formula editing when needed.
🌐 BEUP Canvas live dashboard
- Dedicated web interface at canvas.beup.space/fleet-trip.
- View KPI team, profit trend, top vehicle/route, fuel alerts, and shipment board in the browser.
- Filter by vehicle, route, and month; switch between light and dark mode.
- Switch VI/EN; when using demo, dashboard changes to the correct sample data VI or EN.
- Data is processed in the browser; BEUP does not store your operational files.
KEY FEATURES (11 sheets)
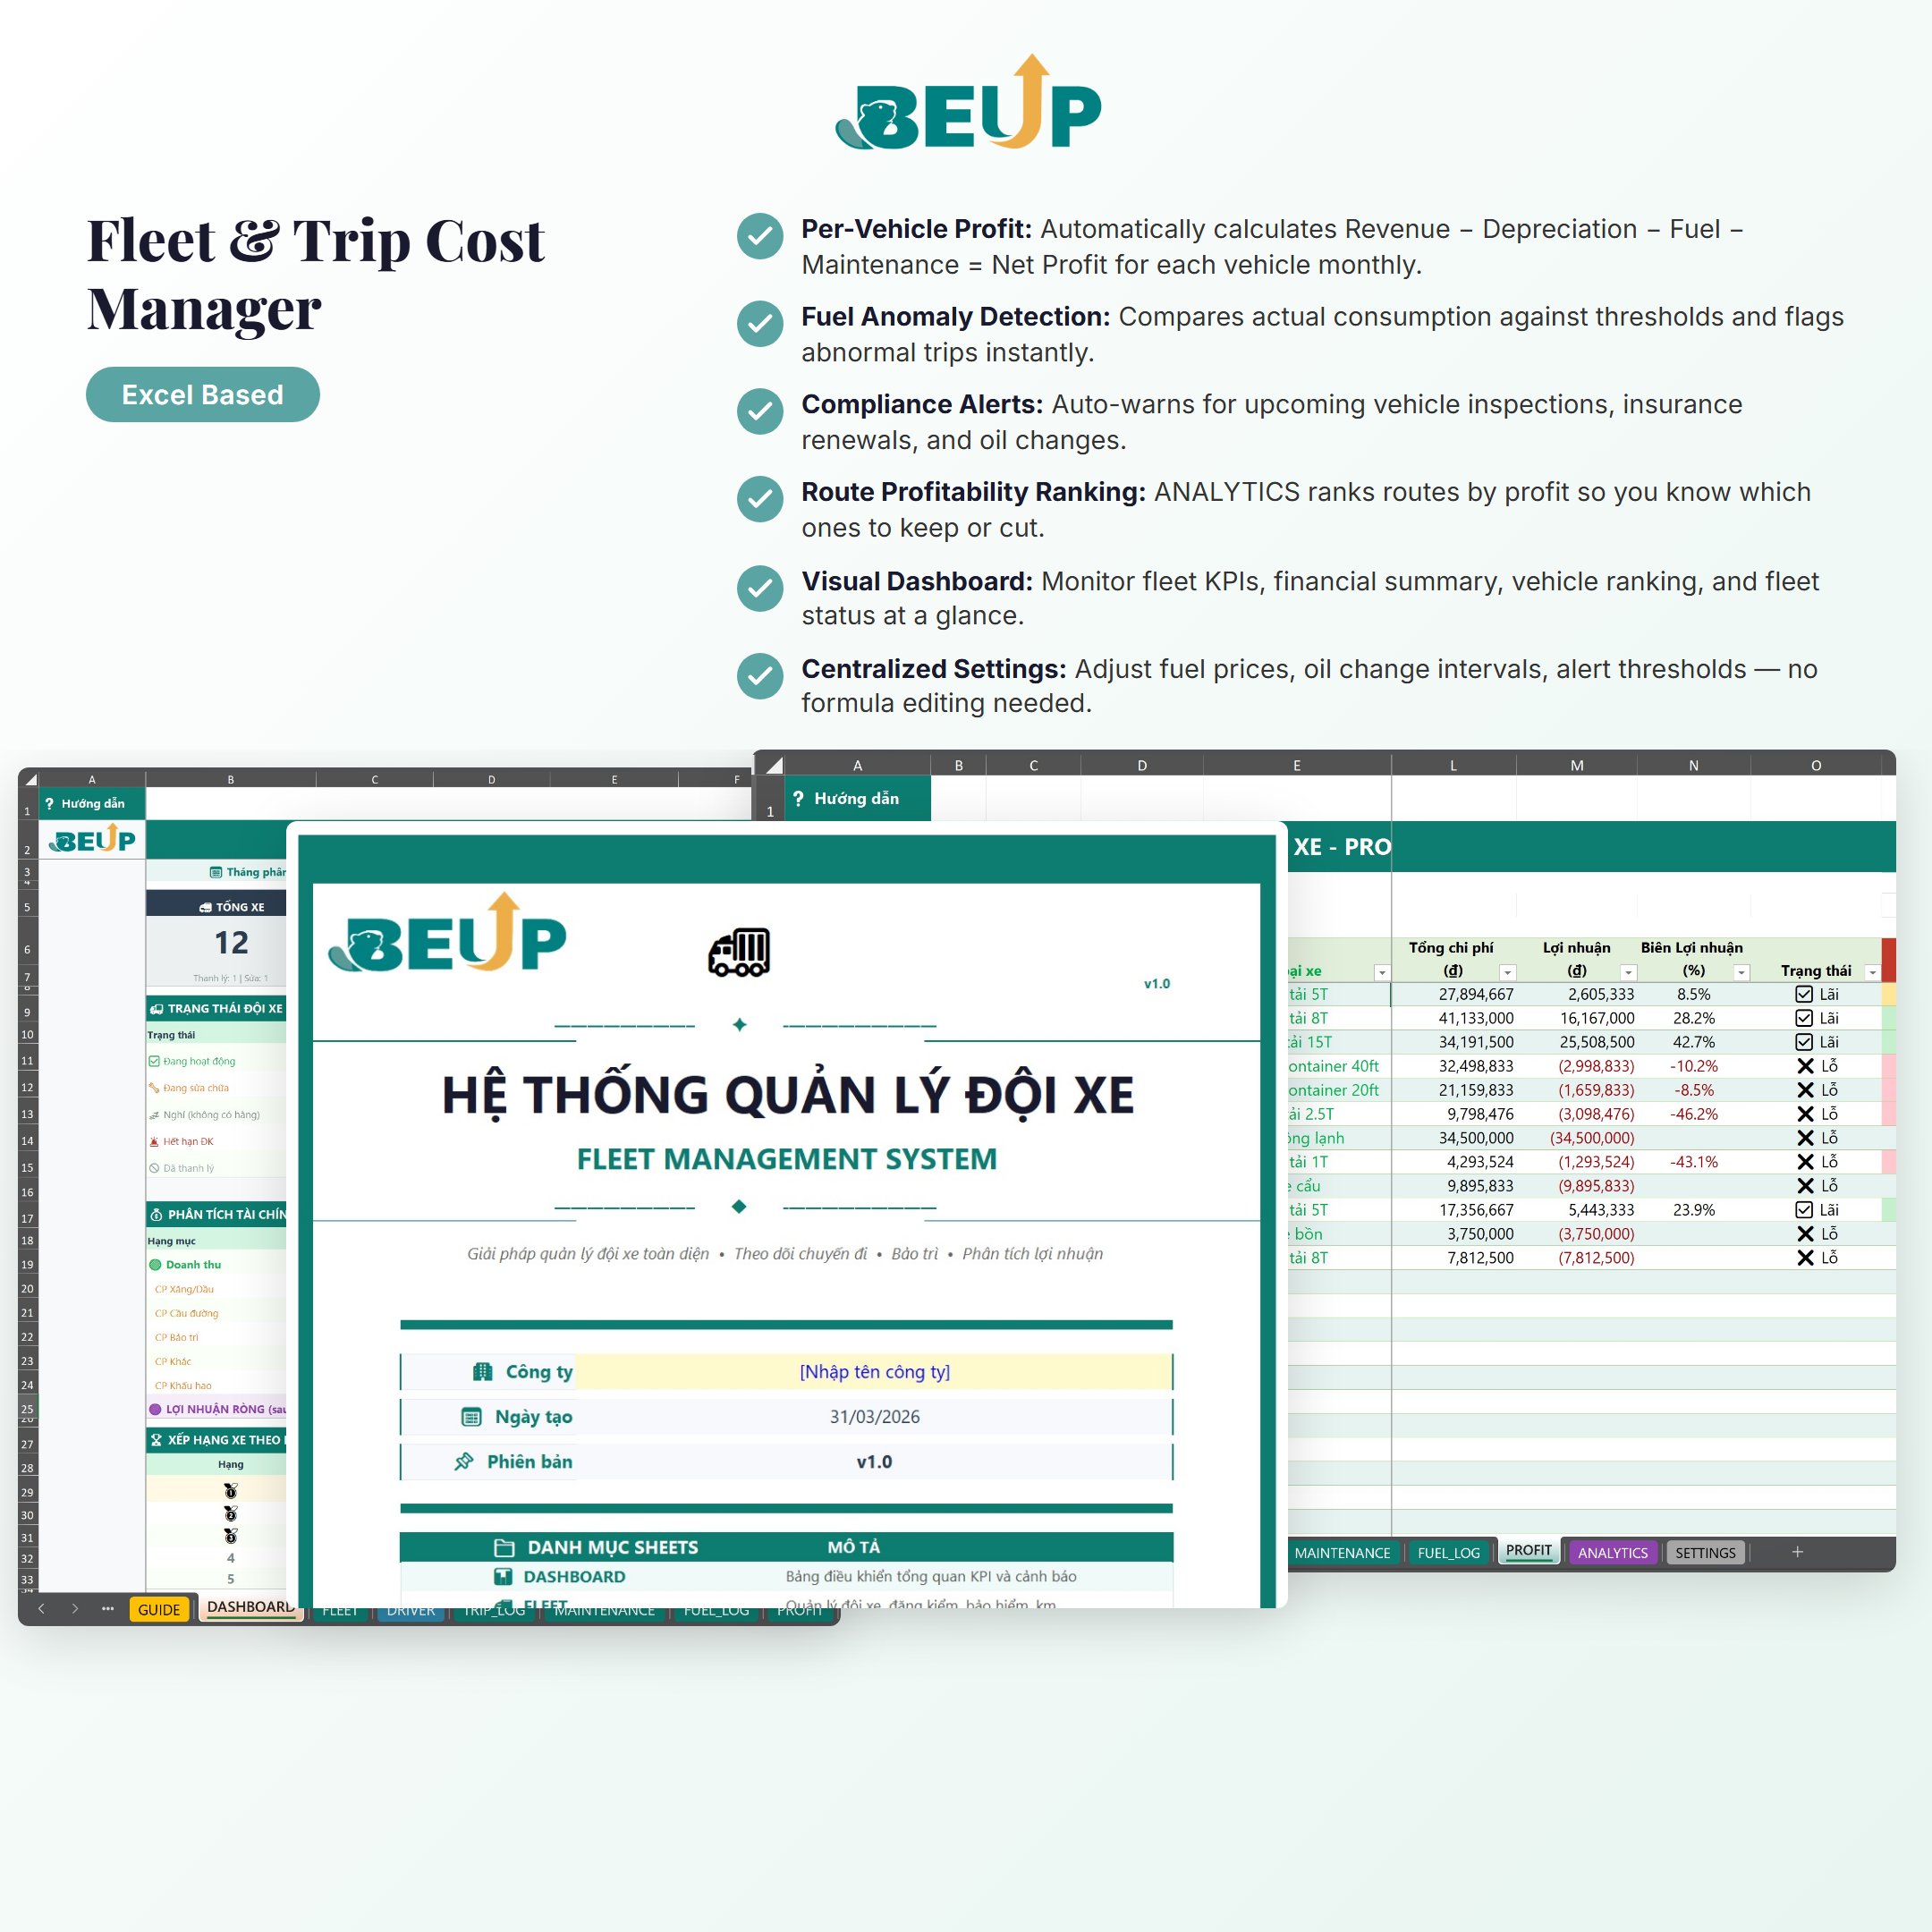
- Dashboard — KPI overview: revenue, expenses, vehicle team profit, dashboard compatible with Excel & Google Sheets.
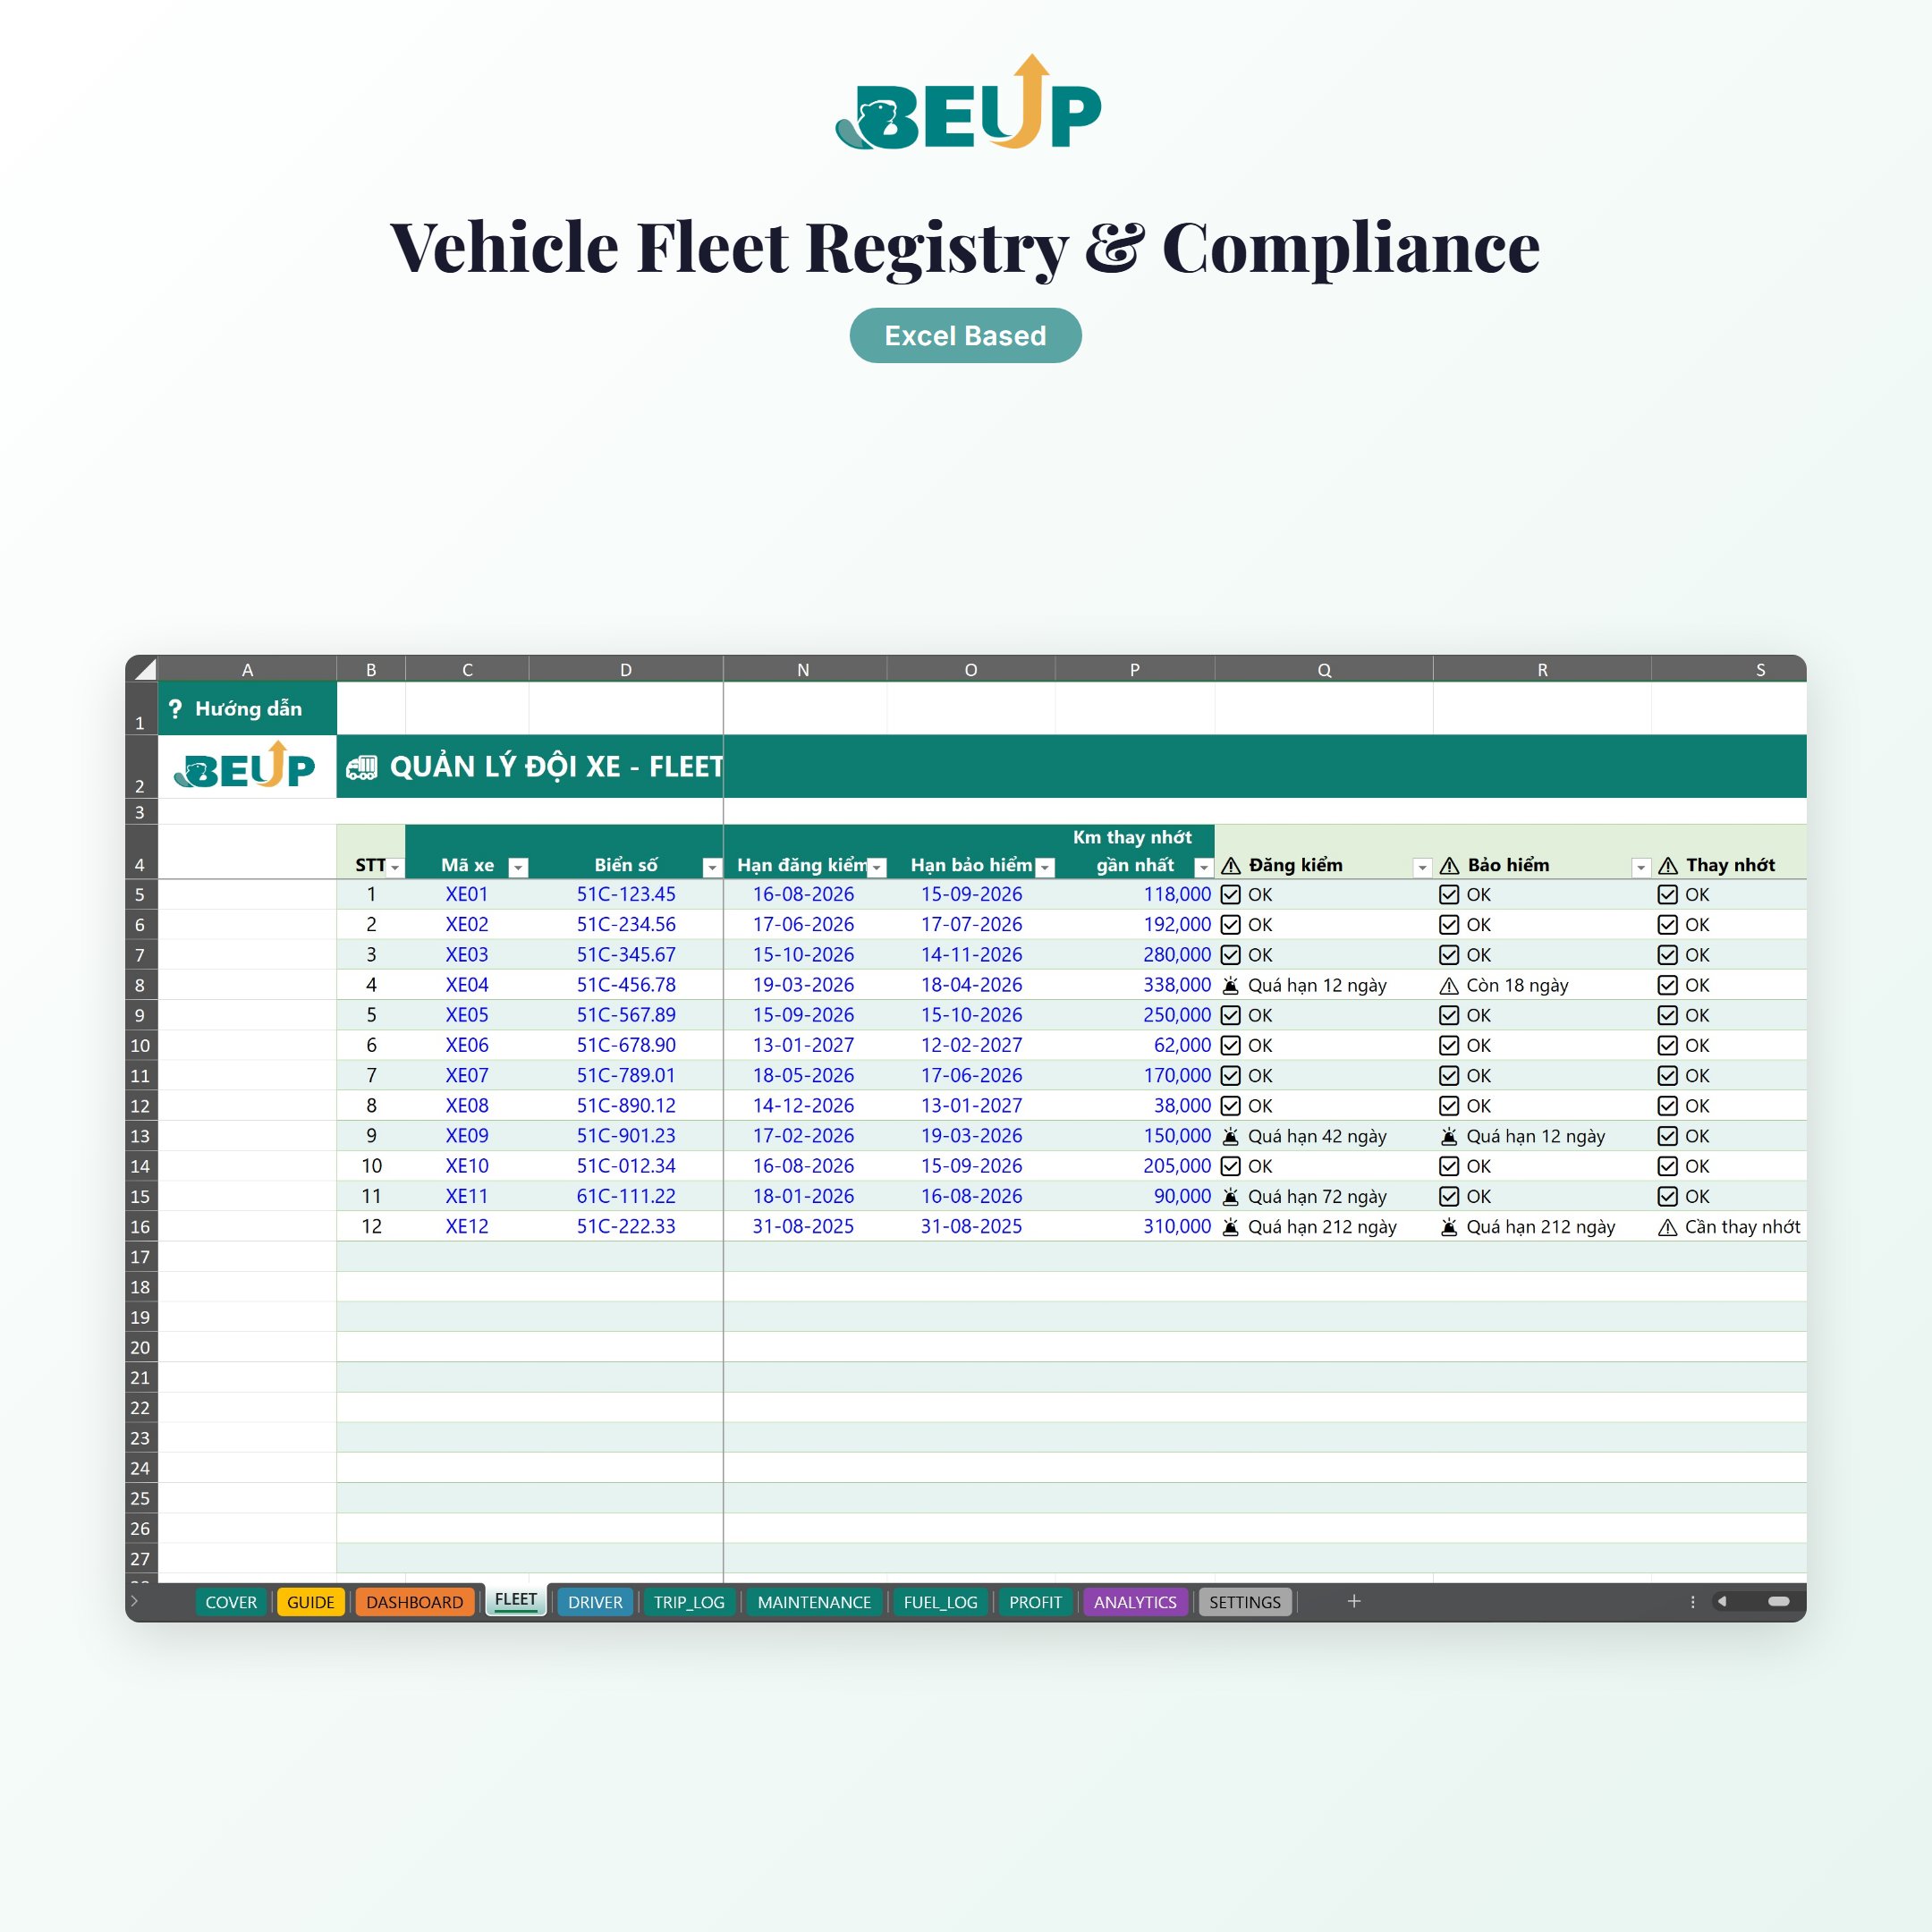
- FLEET — Register and manage vehicle information: vehicle type, license plate, purchase price, depreciation, inspection and insurance alerts.
- DRIVER — Driver list linked to vehicles, assignment tracking.
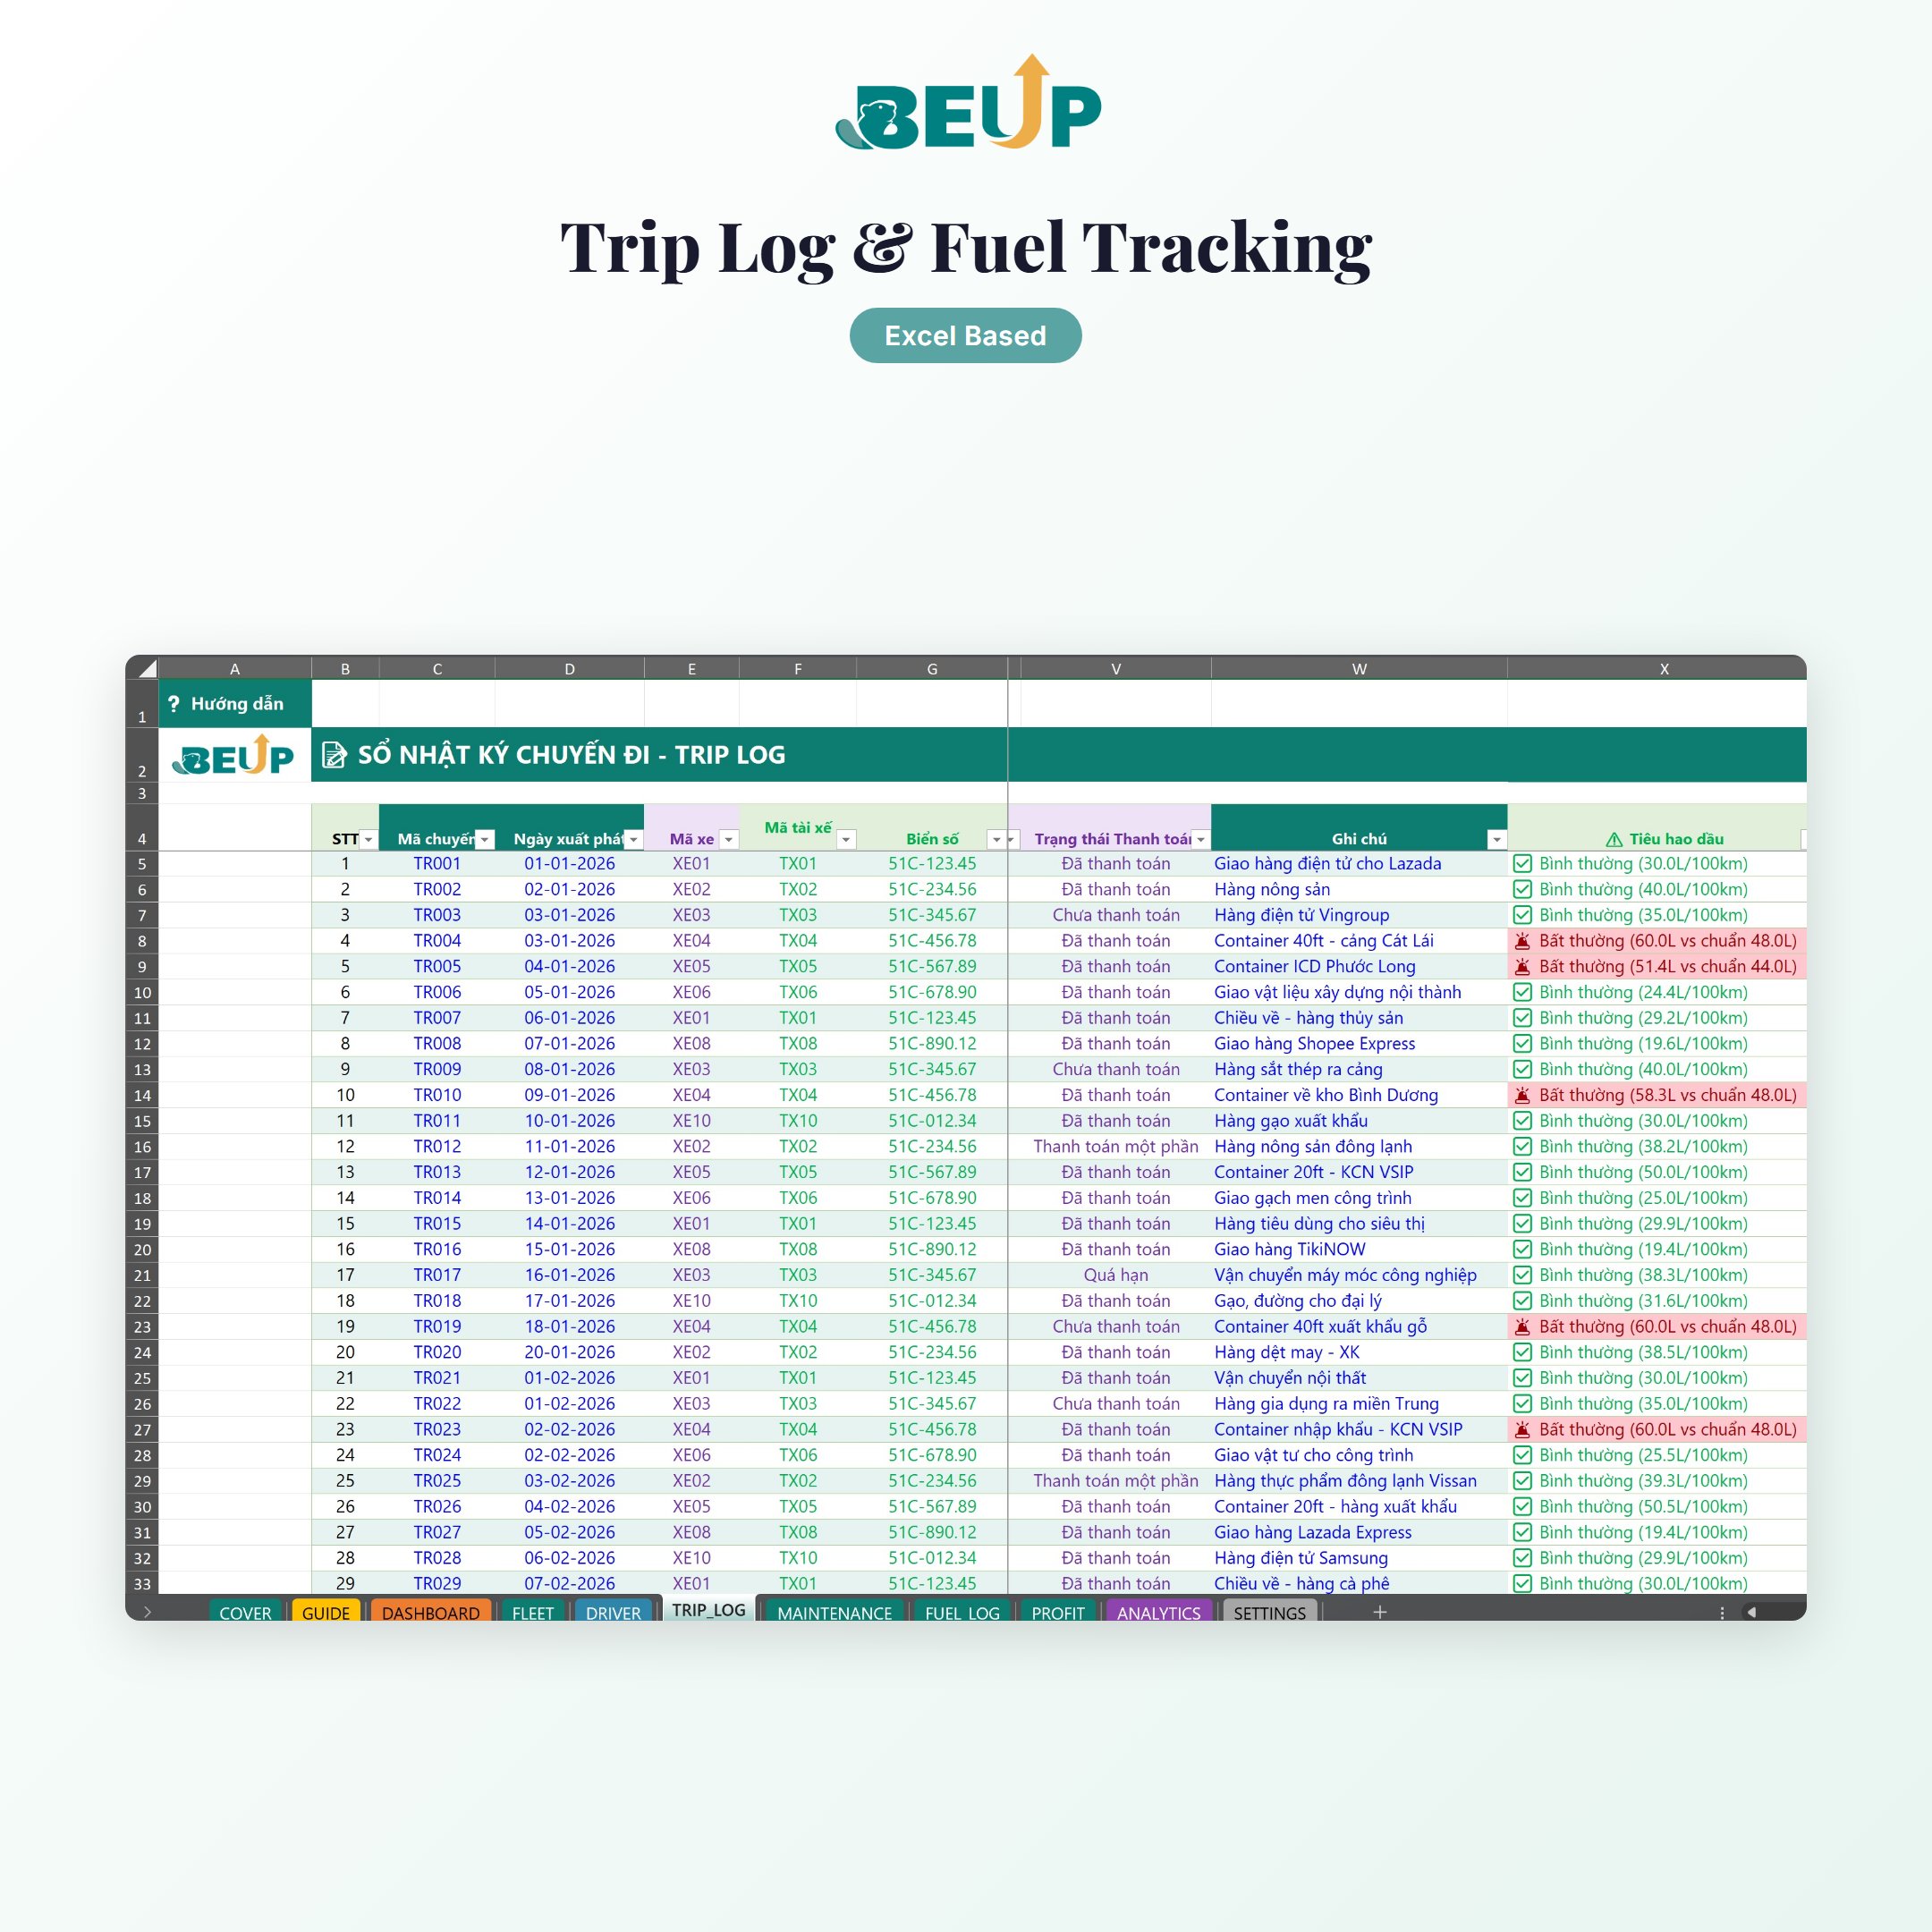
- TRIP_LOG — Record each trip: route, km, revenue, fuel consumption, payment status, detect abnormal oil consumption.
- MAINTENANCE — Maintenance history: oil change, tire change, repair; track costs and vehicle condition.
- FUEL_LOG — Fuel costs: refill date, liters, unit price, fuel type, automatic total cost calculation.
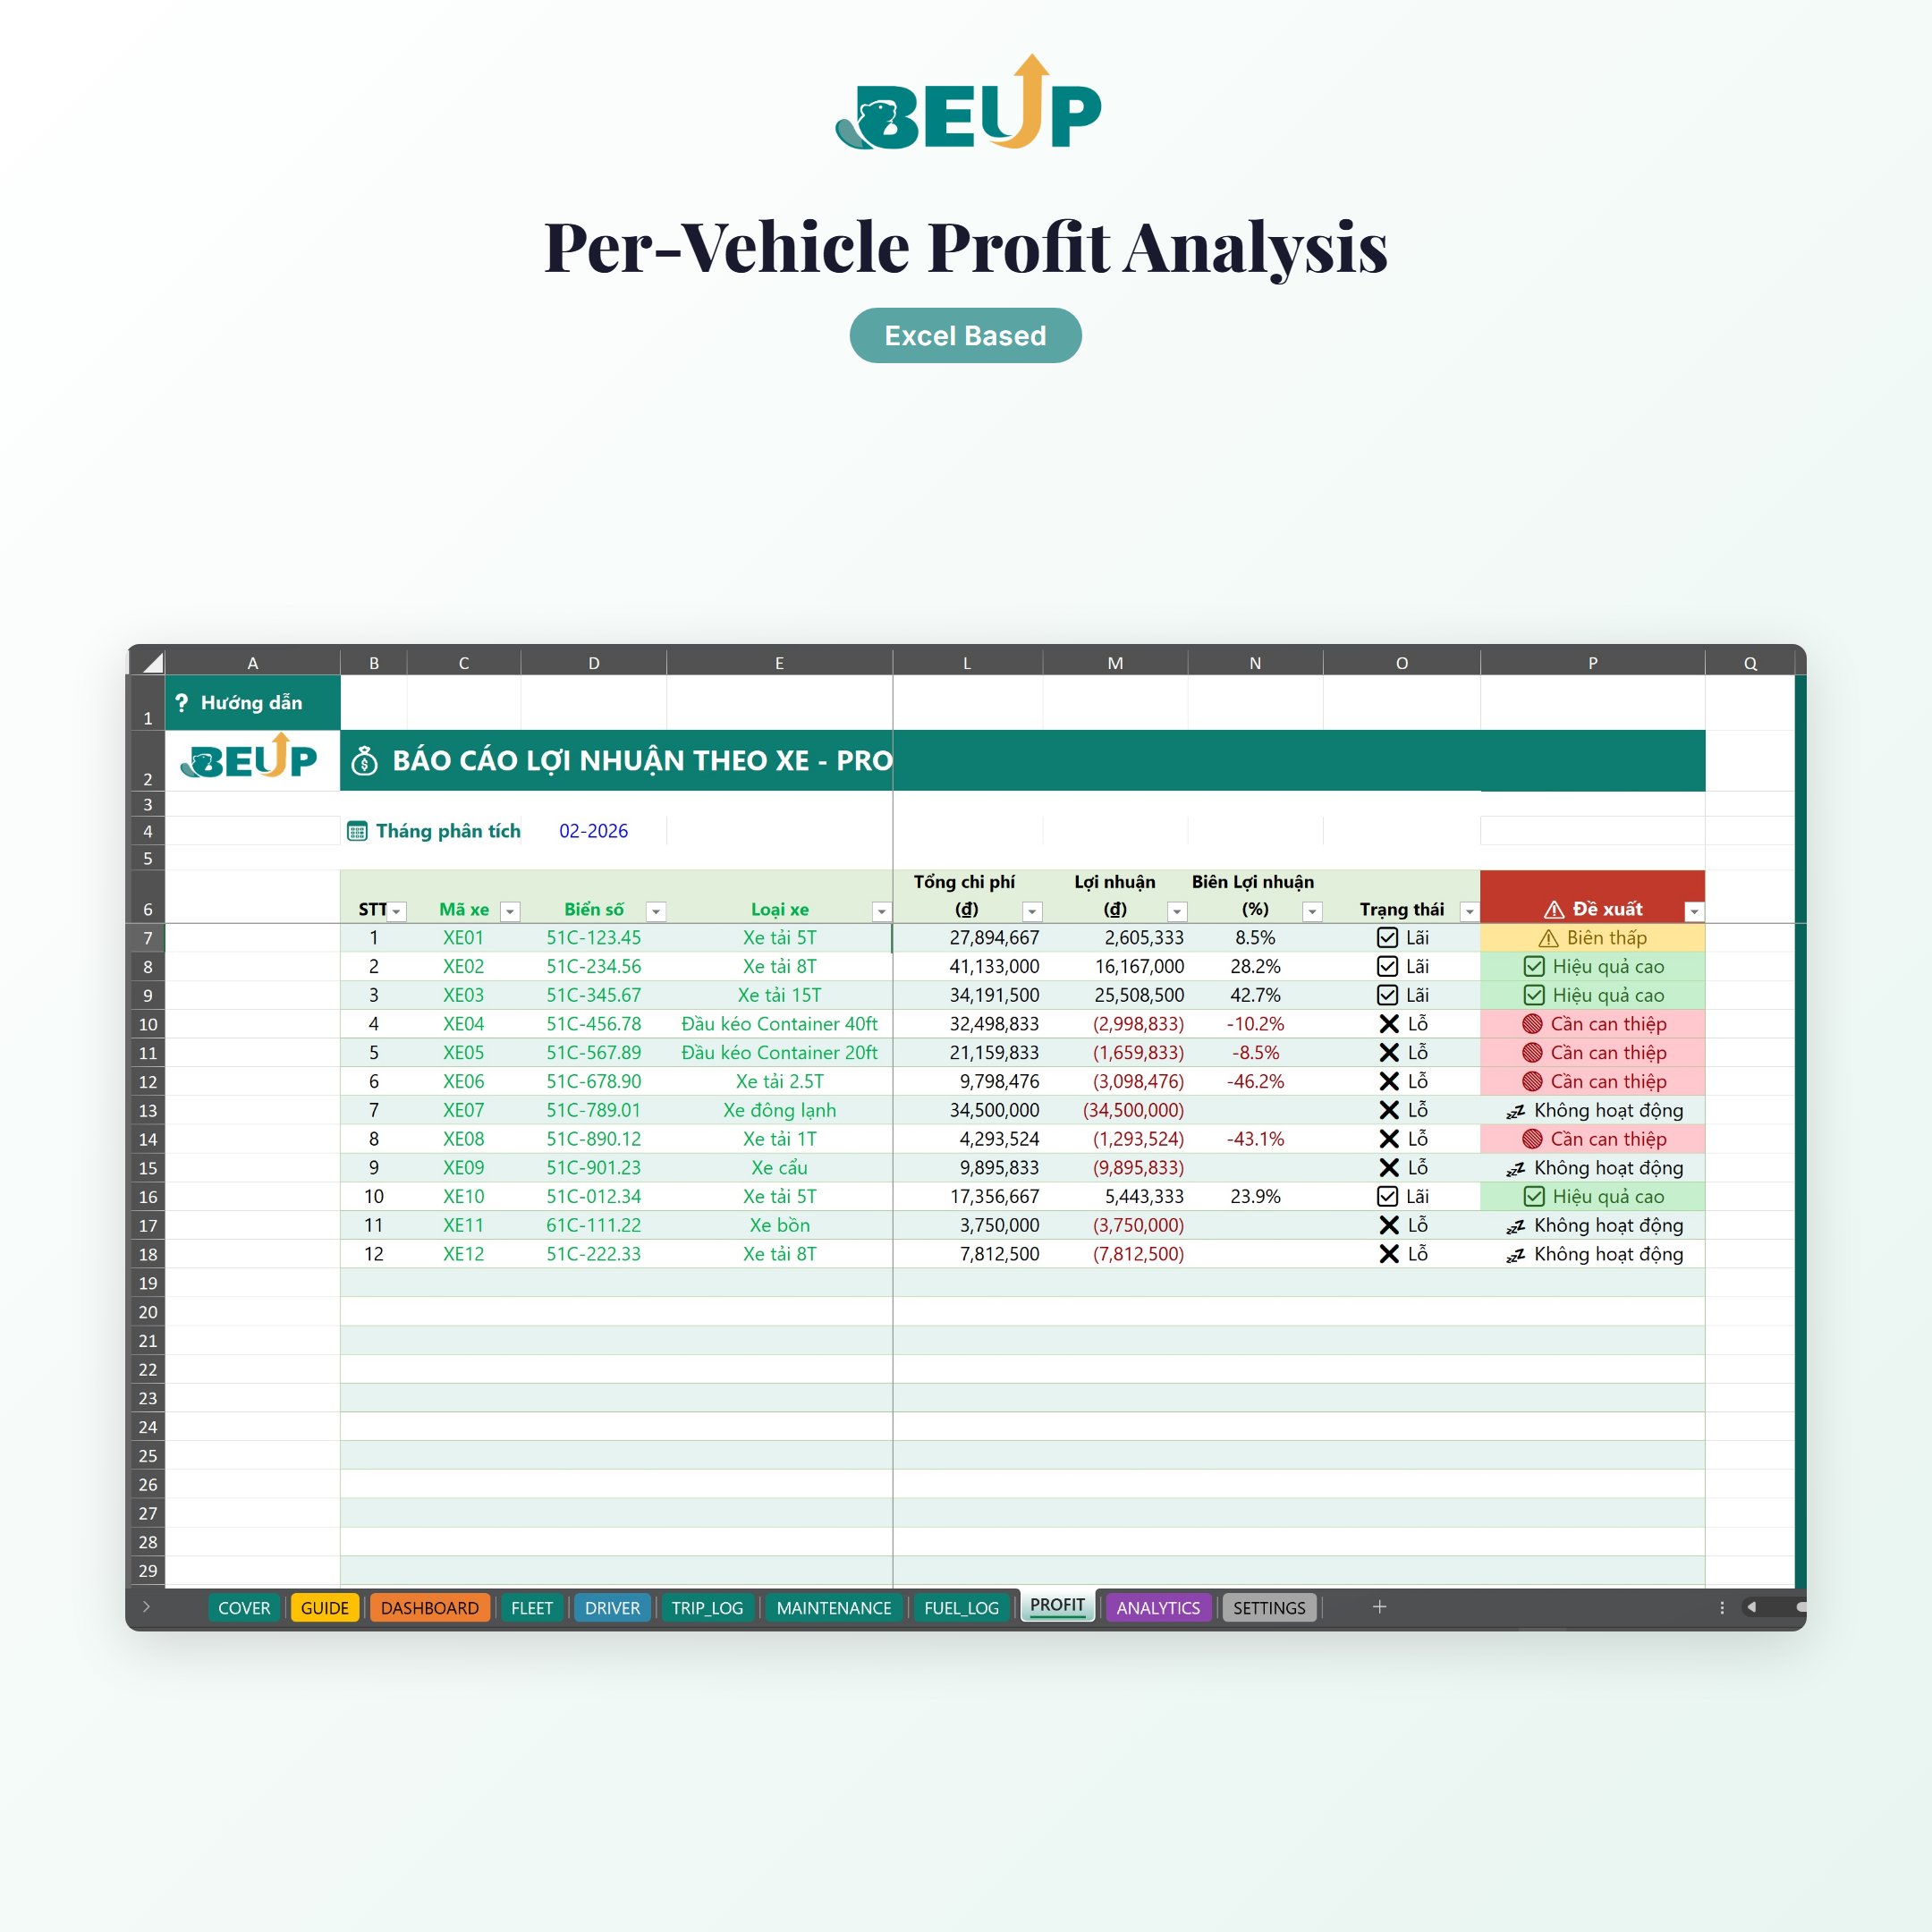
- PROFIT — Net profit/loss per vehicle per month: Revenue — Depreciation — Fuel — Maintenance = Net profit.
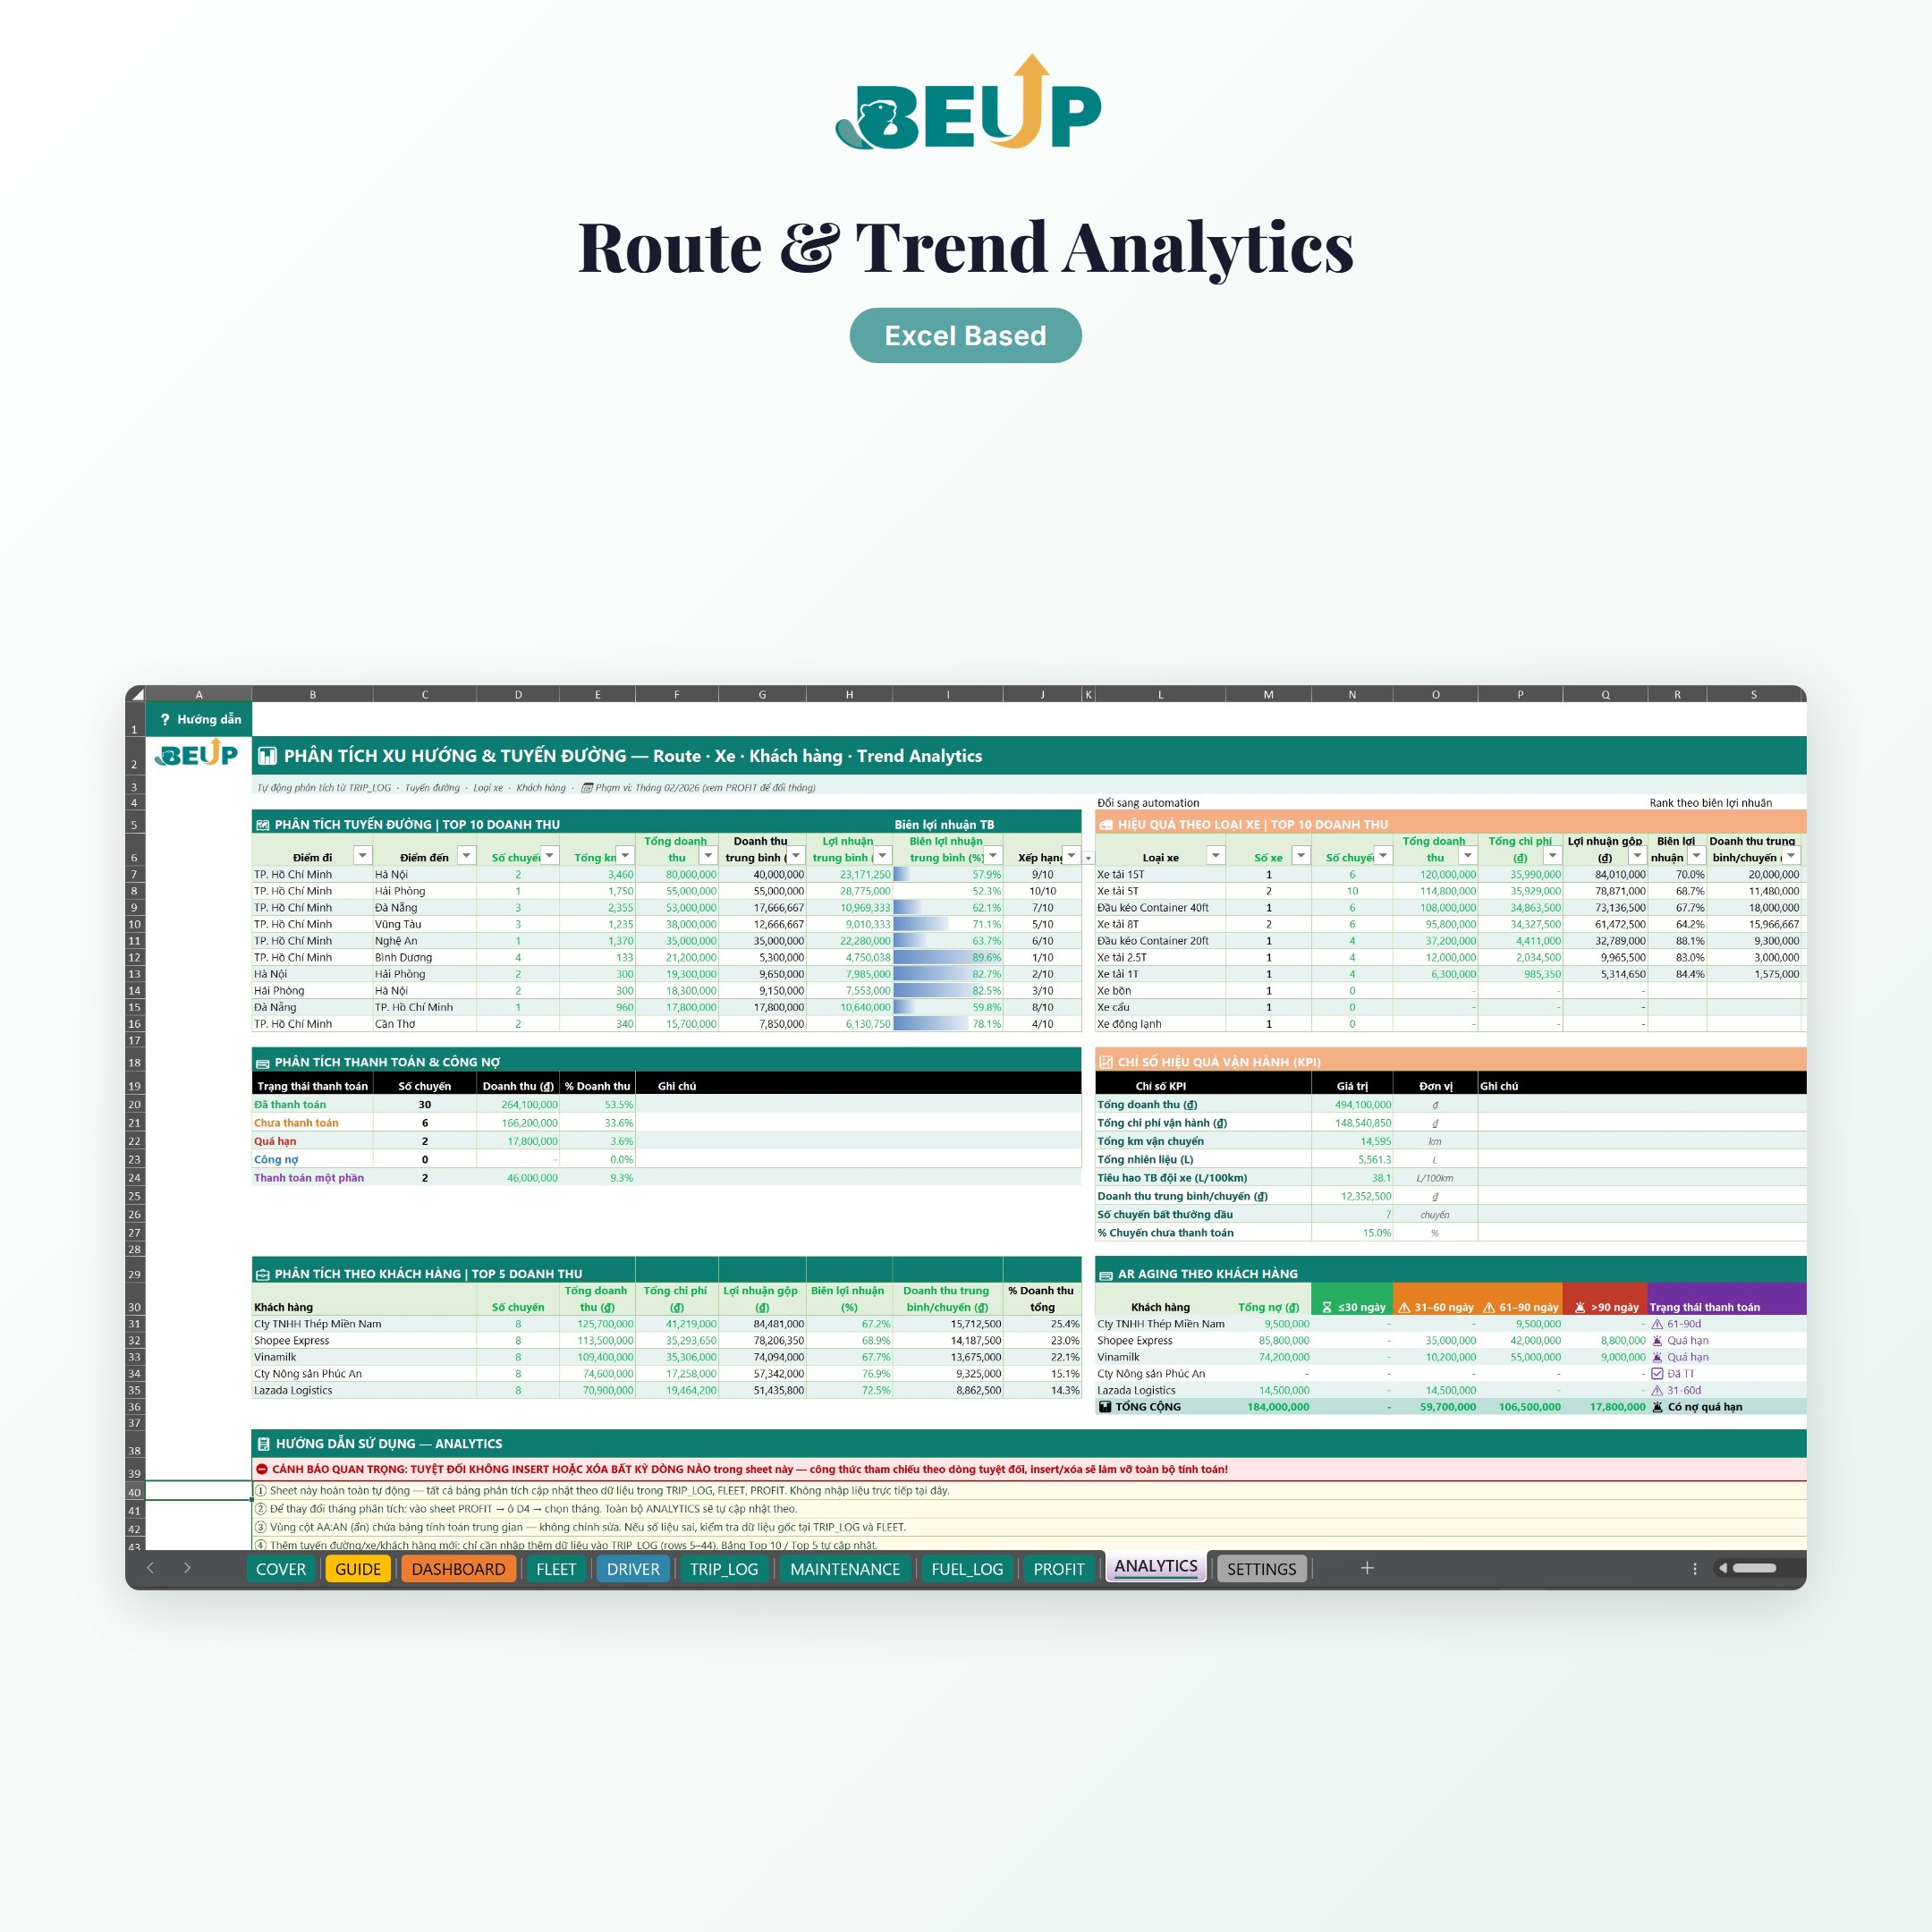
- ANALYTICS — Profit ranking by route, monthly trends, fleet utilization efficiency.
- Settings — All threshold settings are centralized: fuel prices, oil change cycles, inspection alerts, depreciation rates.
Design: Structured Tables automatically expand when adding rows. Named Ranges make auditing easy. No macros or VBA required.
WHO IS THIS FOR?
- Small business owner (5-50 vehicles) — need to know the actual cost of each vehicle and route.
- Delivery/logistics fleet managers — need to report monthly revenue, expenses, fuel, and maintenance.
- Vehicle rental owners or transportation cooperatives — wants to track vehicle efficiency, detect fuel anomalies, and plan proactive maintenance.
- Team needs a web dashboard for quick meetings — use Canvas to view data without opening Excel mobile.
Scale: Suitable for fleets of 5 to 50 vehicles. No limit on the number of trips.
WHAT'S INCLUDED?
- 2 Excel files — a blank Template version and a Sample version with sample fleet data.
- Both versions have Vietnamese and English language options.
- 11 specialized sheets: COVER · GUIDE · DASHBOARD · FLEET · DRIVER · TRIP_LOG · MAINTENANCE · FUEL_LOG · PROFIT · ANALYTICS · SETTINGS.
- GUIDE provides detailed step-by-step instructions for each sheet.
- Pre-built formulas automatically link between sheets.
- Structured Tables automatically expand — add rows without needing to drag formulas.
- Access to the demo and companion dashboard on BEUP Canvas.
COMPARE WITH OTHER SOLUTIONS
| Criteria | BEUP Template + Canvas | Fleet management software | DIY Excel File |
|---|---|---|---|
| Cost | ✓ One-time payment | ✗ $20-50/vehicle/month | ✓ Free but time-consuming |
| Profit/loss per vehicle | ✓ Automatic | ✓ There are | ✗ Manual calculation |
| Web dashboard | ✓ Included with BEUP Canvas | ~ Depends on the plan | ✗ Build it yourself |
| Fuel anomaly detection | ✓ Has warnings | ~ Typically requires GPS | ✗ No |
| Registration/insurance expiry alerts | ✓ Automatic | ✓ There are | ✗ Manual logging |
| Works offline | ✓ Excel works offline | ✗ Internet required | ✓ There are |
HOW IT WORKS
- Open SETTINGS to enter fuel prices, oil change cycles, warning thresholds, and depreciation rates.
- Open FLEET to register vehicle lists with license plates, vehicle types, purchase dates, inspection and insurance information.
- Log trips in TRIP_LOG; update FUEL_LOG when refueling and MAINTENANCE when performing maintenance.
- Open DASHBOARD / PROFIT / ANALYTICS in the workbook to monitor daily operations.
- When you need a quick web view, open the BEUP Canvas demo or connect Google Sheets using the guide in the file.
SYSTEM REQUIREMENTS
- Minimum: Microsoft Excel 2016 or later.
- Recommended: Microsoft 365.
- Google Sheets: Basic compatibility; some conditional formatting or dropdowns may need to be rechecked after uploading.
- BEUP Canvas: use a modern browser. If viewing the live dashboard from Google Sheets, the sheet must be published/shared as instructed in the workbook.
FREQUENTLY ASKED QUESTIONS
Does BEUP Canvas replace the Excel file?
No. Canvas is a companion dashboard for quick review and presentation. Excel / Google Sheets remains the place for data entry and operational records.
When switching to EN, does the demo use the English sample file?
Yes. With the Fleet demo, when switching between VI/EN on Canvas, the dashboard uses sample data corresponding to that language.
Is fleet data sent to BEUP?
No. The dashboard processes data in the browser. BEUP only serves the dashboard app and does not store your operating files.
Can I manage more than 12 vehicles?
Yes. Add a new line to the FLEET table; Structured Tables automatically expand formulas.
Does the file work on Google Sheets?
Basic compatibility. Files using common formulas; conditional formatting and some dropdowns may need to be rechecked after switching to Google Sheets.
Other questions? support@beup.space
Only logged in customers who have purchased this product may leave a review.
Related products
- Dropshipping Profit Analysis + Direct Dashboard — Multi-Platform E-commerce Toolkit0.00 out of 5499.000 VNDBuy Now This product has multiple variants. The options may be chosen on the product page
- F&B Recipe Cost Control — Excel + BEUP Canvas0.00 out of 5Price range: from 499.000 VND to 799.000 VNDBuy Now This product has multiple variants. The options may be chosen on the product page
- Comprehensive Fabric Inventory Management – Stock, In/Out & Reporting | Excel Template0.00 out of 5Price range: from 499.000 VND to 799.000 VNDBuy Now This product has multiple variants. The options may be chosen on the product page
- E-com Profit & Cashflow – Order Tracking & Financial Management | Excel Template0.00 out of 5Price range: from 499.000 VND to 799.000 VNDBuy Now This product has multiple variants. The options may be chosen on the product page


A Digital Asset Ecosystem and Work Operating System for Individuals & Teams
SUPPORT
Copyright © 2026 BEUP Learning Solutions
MST: 3301755602
Reviews
There are no reviews yet.