No products in the cart.


F&B Recipe Cost Control — Excel + BEUP Canvas
Price range: from 25 $ to 40 $
Excel + BEUP Canvas system for F&B: 15 sheets to manage recipes, item-level COGS, Menu Engineering, inventory, variance and P&L, with a live dashboard on BEUP Canvas to review KPIs, filter by item/size and share quickly with your team. Enter data in Excel or Google Sheets, then use either the workbook dashboard or the web dashboard when you need to make decisions.
Sold: 0 items
F&B Recipe Cost Control System is an Excel / Google Sheets toolkit that helps restaurants, cafes and food businesses control ingredient costs per menu item, classify menu profitability, track inventory and read operating profit quickly.
This update adds a BEUP Canvas live dashboard: the same workbook data, shown in a web interface with KPIs, charts and filters on desktop or mobile. You can use Excel offline for data entry, then open Canvas when you need to present numbers or check performance quickly.
👉 Open the BEUP Canvas live demo
YOU GET 2 DASHBOARDS — POWERED BY THE SAME DATA
📊 Workbook dashboard
- Track revenue, total COGS, gross profit, COGS%, order count and average order value.
- See top-selling items, inventory alerts, variance and financial status directly inside Excel / Google Sheets.
- Best for offline entry, internal storage, backups and formula edits when needed.
🌐 BEUP Canvas live dashboard
- Dedicated web interface at canvas.beup.space/fb-recipe-cost-control.
- 3 clear tabs: Overview, Products, Inventory.
- Switch VI / EN language, dark / light mode, and filter by item and size.
- Charts for revenue - COGS - profit, Menu Engineering mix, profit by item, inventory table and variance.
- Data is processed in the browser; BEUP does not store your sales file.
KEY FEATURES (15 sheets)
- Raw Materials – Key raw material price list. Update purchase prices, automatically calculate cost of goods sold per unit.
- Formulas Recipe quantities for each item. Automatically calculate ingredient cost, ingredient cost percentage and gross margin.
- Menu Engineering Automatic classification using the Kasavana & Smith method: Stars, Puzzles, Plowhorses and Dogs, with suggested actions.
- Purchases – Record inventory receipts, automatic unit conversion, linked to raw material price lists.
- Sales Record daily sales. Automatically pull selling prices from Recipes, then calculate revenue and COGS.
- Inventory Ledger Stock movement ledger, tracking inventory in real time with: Opening stock + Purchases - Usage.
- Stock Count – Reconcile system inventory vs actual inventory. Detect discrepancies early.
- Forecasting – Forecast inventory demand, alert for low stock levels.
- P&L Report – Automatic profit and loss reporting from sales and purchase data. No manual entry required.
- Dashboard Core KPIs: revenue, COGS, gross profit, ingredient cost ratio, top-selling items, inventory alerts and analysis charts.
- Suppliers – Manage suppliers, purchase prices, and order history.
- Settings System configuration, dropdown lists and named ranges.
- Cover, Guide, Chart Data – Cover page, detailed user guide, chart data.
Design: 15 connected sheets inside the workbook. Change an ingredient purchase price and every item-level ingredient cost ratio updates automatically. Enter sales, inventory decreases automatically and the P&L report recalculates.
WHO IS THIS FOR?
- Restaurant, eatery and cafe owners Control COGS and profit for each menu item.
- F&B managers Track recipes, inventory and ingredient cost ratio.
- Central kitchens / cloud kitchens Manage multiple menus in one system.
- Catering services Track profit by event and by menu.
- Operations teams that need quick reporting Use Canvas to view the dashboard without opening Excel on mobile.
Scale: Suitable for teams of 5-50 staff and menus with 10-200+ items. Typical food cost benchmark: 28-35%.
WHAT'S INCLUDED?
- Template file (.xlsx) - blank structure, ready to use.
- Sample file (.xlsx) - includes cafe sample data for reference.
- 15 professionally linked sheets.
- Prebuilt and optimized Google Sheets template.
- Detailed instructions inside the Guide sheet.
- Access to the demo and companion dashboard on BEUP Canvas.
- Includes both English and Vietnamese versions.
COMPARE WITH OTHER SOLUTIONS
| Criterion | BEUP Template + Canvas | POS / F&B software | DIY Excel |
|---|---|---|---|
| Cost | ✓ One-time payment | ✗ Monthly fee | ~ Free, but time-consuming |
| Item-level COGS | ✓ Automatic | ~ Depends on the software | ✗ Manual calculation |
| Web dashboard | ✓ Included with BEUP Canvas | ~ Depends on the plan | ✗ Build it yourself |
| Menu Engineering | ✓ Built in | ✗ Rarely included | ✗ Build it yourself |
| Customization | ✓ 100% flexible | ✗ Limited | ✓ Fully customizable |
| Offline use | ✓ Excel works offline | ✗ Internet required | ✓ Completely |
HOW TO USE
- Download the .xlsx file and open it in Excel, or copy it to Google Sheets.
- Enter ingredients, recipes, selling prices and sales data.
- The workbook calculates COGS, COGS%, profit and inventory alerts automatically.
- Use the workbook dashboard for daily operations.
- When you need a quick web view, open the BEUP Canvas demo or connect Google Sheets using the guide in the file.
SYSTEM REQUIREMENTS
- Minimum: Microsoft Excel 2016+ (Windows or Mac).
- Recommended: Excel 2021 or Microsoft 365.
- Google Sheets: compatible with the optimized Google Sheets template.
- BEUP Canvas: use a modern browser. If viewing the live dashboard from Google Sheets, the sheet must be published/shared as instructed in the workbook.
FREQUENTLY ASKED QUESTIONS
Does BEUP Canvas replace the Excel file?
No. Canvas is a companion dashboard for quick review and presentation. Excel / Google Sheets remains the place for data entry and operational records.
Is sales data sent to BEUP?
No. The dashboard processes the file/sheet in the browser. BEUP only serves the dashboard app and does not store your sales data.
Does a small shop with under 10 staff need this?
Yes. The smaller the shop, the thinner the margin - a 5% food cost variance can be the difference between profit and loss.
How is this different from POS software?
POS records sales transactions. This system controls COGS - calculating ingredient cost by item, analyzing profit and controlling inventory. The two systems complement each other.
Is there an English version?
Yes. Choose the English or Vietnamese version when ordering. The Bundle includes both.
Are formulas protected?
Sheets are protected, but you can unprotect them without a password to inspect or edit.
Other questions? support@beup.space
Only logged in customers who have purchased this product may leave a review.
Related products
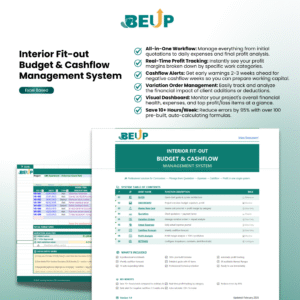
- Construction Cost Estimation & Cash Flow – Accurate Interior Budget Management | Excel Template0.00 out of 5Price range: from 39 $ to 59 $Buy Now This product has multiple variants. The options may be chosen on the product page
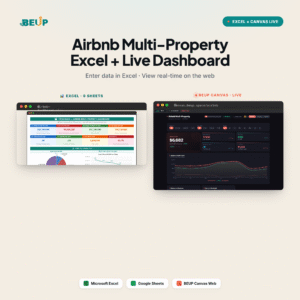
- Managing Multiple Airbnb Listings — Excel + Live Dashboard on BEUP Canvas0.00 out of 5Price range: from 25 $ to 39 $Buy Now This product has multiple variants. The options may be chosen on the product page
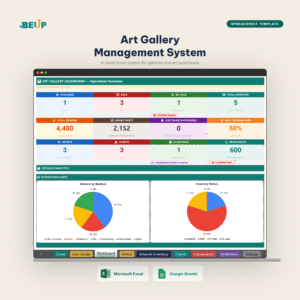
- Art Gallery Management — Artists, Artworks, Customers & Transactions0.00 out of 5Price range: from 25 $ to 40 $Buy Now This product has multiple variants. The options may be chosen on the product page
- Buy Now This product has multiple variants. The options may be chosen on the product page
A Digital Asset Ecosystem and Work Operating System for Individuals & Teams
SUPPORT
Copyright © 2026 BEUP Learning Solutions
MST: 3301755602
Reviews
There are no reviews yet.