No products in the cart.



9 min read
This month's fleet revenue is 180 million. Gas, tolls, driver salaries, minor repairs — everything is recorded, but scattered across notebooks, messages, and memory. By the end of the month, when we add it all up: the net profit is only 11 million — from 8 vehicles running every day. No one can explain where the remaining 169 million went, and more importantly, no one knows which trips are profitable and which are not.
This situation is so common that it's almost the default in Vietnam's small transportation industry. This article delves into the mechanism of this problem — why managing a fleet with Excel having a structure is the most suitable solution for businesses with 5–20 vehicles, and how to design a tracking system to know the exact profit and loss per shipment.
Short answer: Managing a fleet with Excel is suitable for small transportation businesses with 5–20 vehicles that want to track costs and profits per shipment without complex software. The system requires 3 layers of data: vehicle table (information and fixed costs), trip table (revenue and variable costs per trip), and a dashboard (profit by vehicle, route, and driver). This structure helps detect unprofitable routes, control fuel consumption, and make expansion decisions based on real data.
In this article
Most small transportation businesses evaluate their performance based on total monthly revenue. That figure provides a sense of security — 150 million, 200 million, the fleet is running smoothly. However, revenue in transportation hides many layers of costs: fuel is in the gas station bill, tolls are in the receipt, driver salaries are in the payroll book, and maintenance is in the manager's memory. To know the true profit, you need to pull data from at least 5 different sources — and in reality, almost no one does that in enough detail.
The most serious consequence is not losing money without knowing it, but having no basis for making decisions. Should you buy more vehicles or not? Which route should you expand? Which driver is operating efficiently? All of these become guesses when there's no cost data per trip.
| Criteria | Managing with a notebook / relying on memory | Managing with structured Excel |
|---|---|---|
| Knowing profit/loss per trip | Only knowing the total at the end of the month | Knowing immediately after entering the trip |
| Detecting loss-making routes | After a few months, if lucky | Right in the first week |
| Controlling fuel consumption | Based on driver reports | Comparing actual km to fuel consumption |
| Maintenance costs | Surprised when the vehicle breaks down | Automatic reminders based on km |
| Deciding to expand the fleet | Relying on intuition | Based on actual profit data |
Lumping all costs together. Fuel, tolls, driver meals, loading fees — all recorded in a single line as “trip cost”. This recording method makes it impossible for managers to distinguish between fixed costs (depreciation, insurance, parking fees) and variable costs (fuel, tolls, loading). If you can't tell them apart, you can't optimize — because each type requires a completely different control approach.
A vehicle runs 300,000 km without replacing the chain sprocket — every trip “profits” on paper. Then the engine breaks down, 80 million VND to repair, and a whole year's profit is gone. Depreciation isn't a future cost — it's a cost happening every kilometer you drive.
— The most common mistake in managing costs for small fleets
Not factoring depreciation and maintenance into trip costs. A truck worth 800 million VND, used over 8 years, is “consuming” about 275,000 VND/day in depreciation — whether it runs or not. Add insurance, inspection fees, parking fees, and loan interest if financed. All these costs must be allocated across every trip to know the real profit. Skip them, and every profit calculation is wrong from the start.
Completely trusting driver-reported costs. It's not a matter of dishonesty — everyone forgets details, everyone rounds numbers. An 85 km trip easily gets recorded as 90 km. A 45-liter fuel fill-up gets remembered as 50 liters. Small discrepancies per trip, but multiplied by 100 trips/month, the error becomes significant. You need a cross-check system: compare actual km with average fuel consumption by vehicle type — a variance above 15% is a red flag worth investigating.
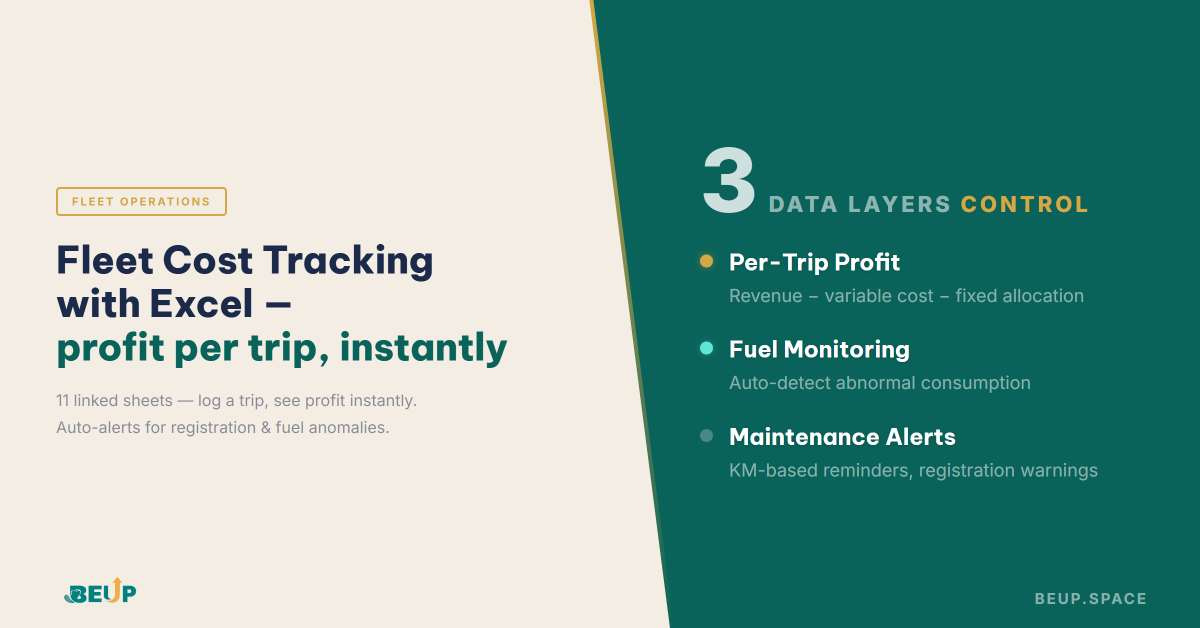
Designing a fleet tracking system isn’t complicated if you organize data into 3 clear layers. Each layer answers a different question, and the three combined create a comprehensive financial picture of the fleet.
3 data layers for fleet management
The most important point when designing these 3 layers is linking data between them. The vehicle table provides fixed costs to the trip table. The trip table provides transaction data to the dashboard. When a new trip is added, the entire system updates — no manual calculations, no copy-pasting between sheets. This is why structured Excel is superior to a notebook: not because data entry is faster, but because data self-links and self-calculates.
When trip data is fully recorded, the first analysis step should be ranking profit by route. The table below illustrates how a fleet of 8 vehicles running urban and intercity routes discovered which routes were truly creating value.
| Route | Trips/month | Doanh thu TB | Avg. cost | Profit/trip | Profit/month |
|---|---|---|---|---|---|
| HCMC → Binh Duong | 45 | 1.2 million | 850k | 350k | 15.75 million |
| TP.HCM → Long An | 30 | 1.8 million | 1.5 million | 300k | 9.0 million |
| HCMC → Dong Nai | 25 | 2.0 million | 1.1 million | 900k | 22.5 million |
| HCMC → Vung Tau | 8 | 4.5 million | 3.8 million | 700k | 5.6 million |
The most notable figure lies in the Đồng Nai route: a profit of 900,000đ per trip — 2.5 times higher than the Bình Dương route — but few people notice because the absolute revenue per trip is not as outstanding as Vũng Tàu. Meanwhile, the Bình Dương route accounts for 35% of the total number of trips but only contributes around 30% of the profit — with the lowest profit margin per trip in the entire team. If we reduce 10 Bình Dương trips and switch to Đồng Nai, the total profit increases by 5.5 million/month — equivalent to an 18% increase in margin without adding more vehicles or drivers.
Route-level analysis is just the first step. On the same route, two different drivers can produce profit differences of 20–30% — due to different fuel consumption rates, different loading/unloading times, different on-time delivery rates (affecting repeat customers). A profit dashboard by driver is the second layer of analysis, and often the one that delivers the most surprising insights.
Fuel and road tolls are expenses everyone sees — because they're paid immediately. But the largest transportation cost belongs to things that don't require daily payment: vehicle depreciation, tire wear, and periodic maintenance. A 800-million truck depreciated linearly over 8 years 'spends' 275,000đ daily. Tires replaced every 50,000 km at 12–18 million per set, about 60–80,000đ per 1,000 km. Installment loan payments: 500–800,000đ/month depending on remaining debt. These hidden costs easily comprise 15–25% of total operating expenses, but almost never appear in daily ledgers.
No mileage-based maintenance schedule
Has maintenance schedule with automatic alerts
Preventive maintenance doesn’t just reduce repair costs — it reduces downtime. Every day a vehicle sits idle waiting for repairs is a day of lost revenue. With a vehicle averaging 3 trips/day, each trip profiting 500,000 VND, one unexpected breakdown taking 3 days to fix means losing 4.5 million in profit — not counting the inflated emergency repair costs. This is why km-based maintenance scheduling isn’t “nice to have” but the centerpiece of fleet cost management.
Know exactly which vehicle is profitable, which route is losing money — with just Excel
Fleet Management & Trip Efficiency — 11 linked sheets, enter a trip and know profit instantly, automatic inspection alerts and fuel anomaly detection.
With 20–50 vehicles, Excel still works well if you use Structured Tables and Named Ranges properly — data auto-expands when new rows are added. Above 50 vehicles, if multiple people need to enter data simultaneously, consider switching to Google Sheets or combining with Apps Script to automate data entry from phones.
Cross-check 3 data sources: actual km vs driver-reported km, average fuel consumption by vehicle type vs reported consumption, and costs for the same route across different drivers. The Fleet Trip Cost Manager system automatically flags fuel consumption anomalies when discrepancies exceed the configured threshold — typically 15% above average.
Minimum at the end of each day. The most effective way: drivers send photos of fuel and toll receipts via the messaging app right after the trip, and managers enter them at the end of the day. If delayed until the end of the week, small details are forgotten and errors increase rapidly — especially with loading and meal expenses.
For trucking fleets, calculating by km is more accurate — because vehicles that run more wear out faster, regardless of time. Formula: (Purchase price − Estimated salvage value) ÷ Total expected km of use = Depreciation cost per km. Example: truck costing 800 million VND, salvage value 150 million, running 500,000 km → depreciation of 1,300 VND/km. The Fleet Trip Cost Manager template supports both depreciation methods.
GPS software tracks location and routes — but doesn’t calculate profit. GPS shows where the vehicle is and how many km it traveled, but doesn’t know if the trip was profitable or not. Excel adds the financial layer that GPS lacks: attaching revenue, costs, and profit to each trip. The two tools complement each other, not replace each other.
Get insights on management, operations & digital assets delivered to your inbox.

Copyright © 2026 BEUP Learning Solutions
MST: 3301755602
Book a free consultation to explore how BEUP can transform your workflow.
Book a Consultation →Digital Asset Ecosystem & Operating System for individuals & teams.